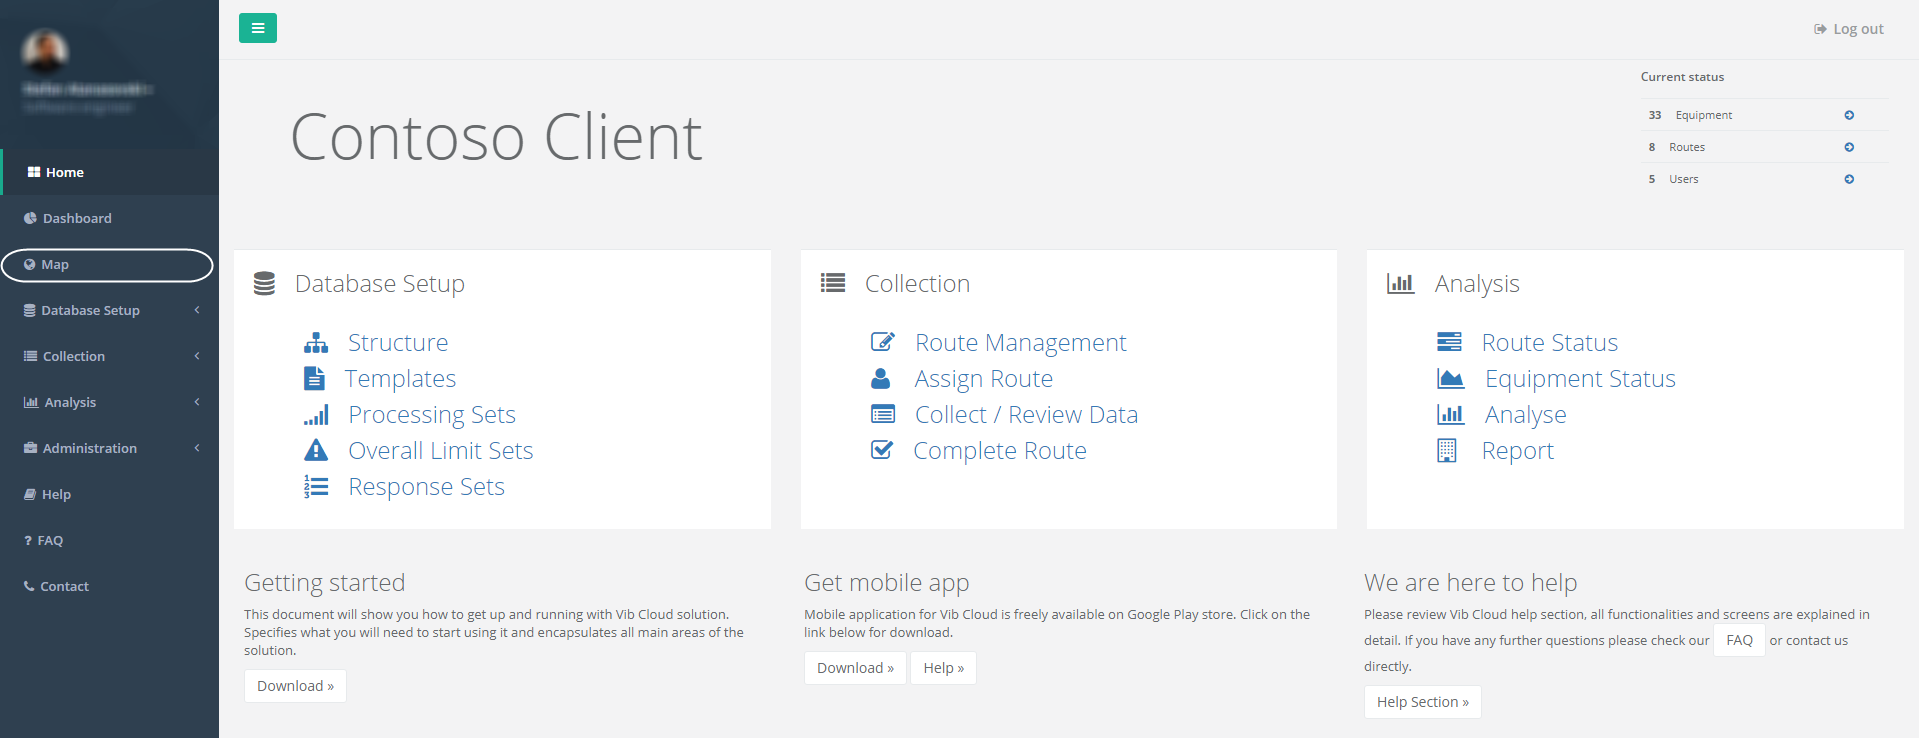
This module was designed for user to have visual representation of the location of the equipment and components on the map (google maps).
What is shown on the map?
On the map are shown only those equipment and components for which GPS Coordinates has been set in the “Structure Identification” (please check Structure Functionalities for more details). Each equipment or component is displayed with marker which, depending on current condition and measured values, can be with different shape and color.
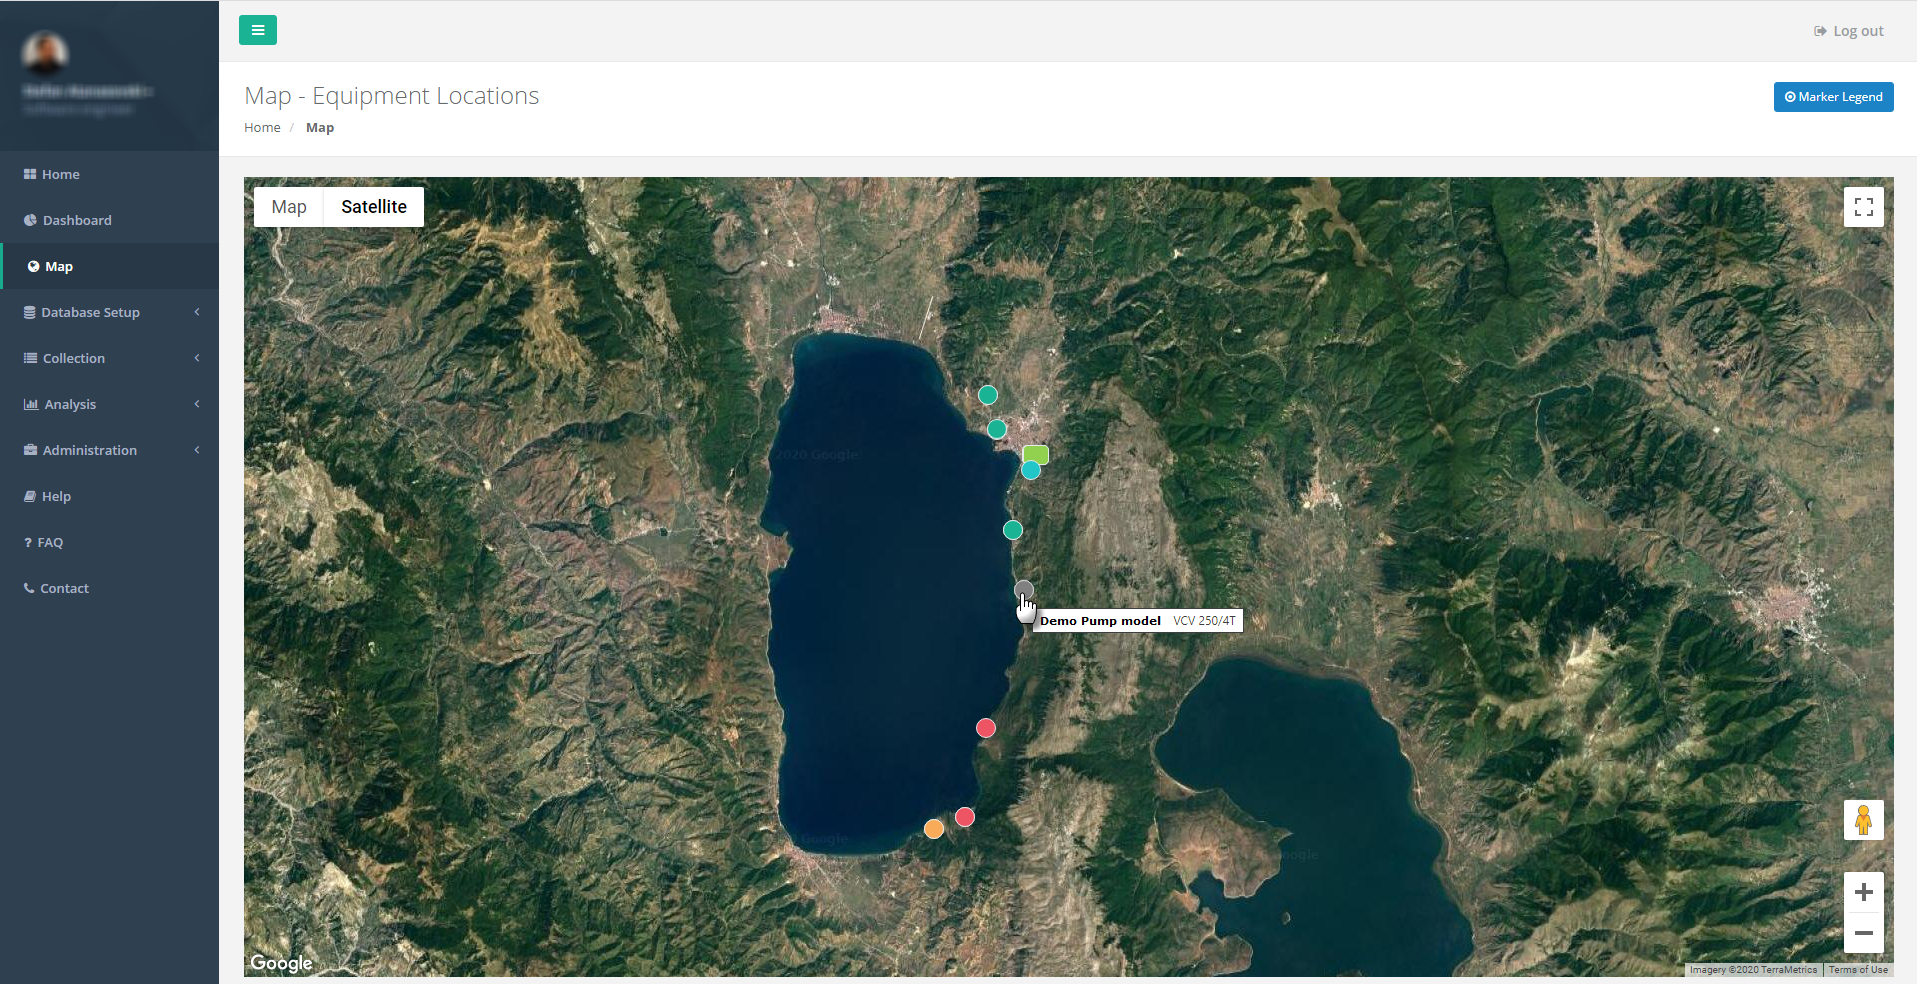
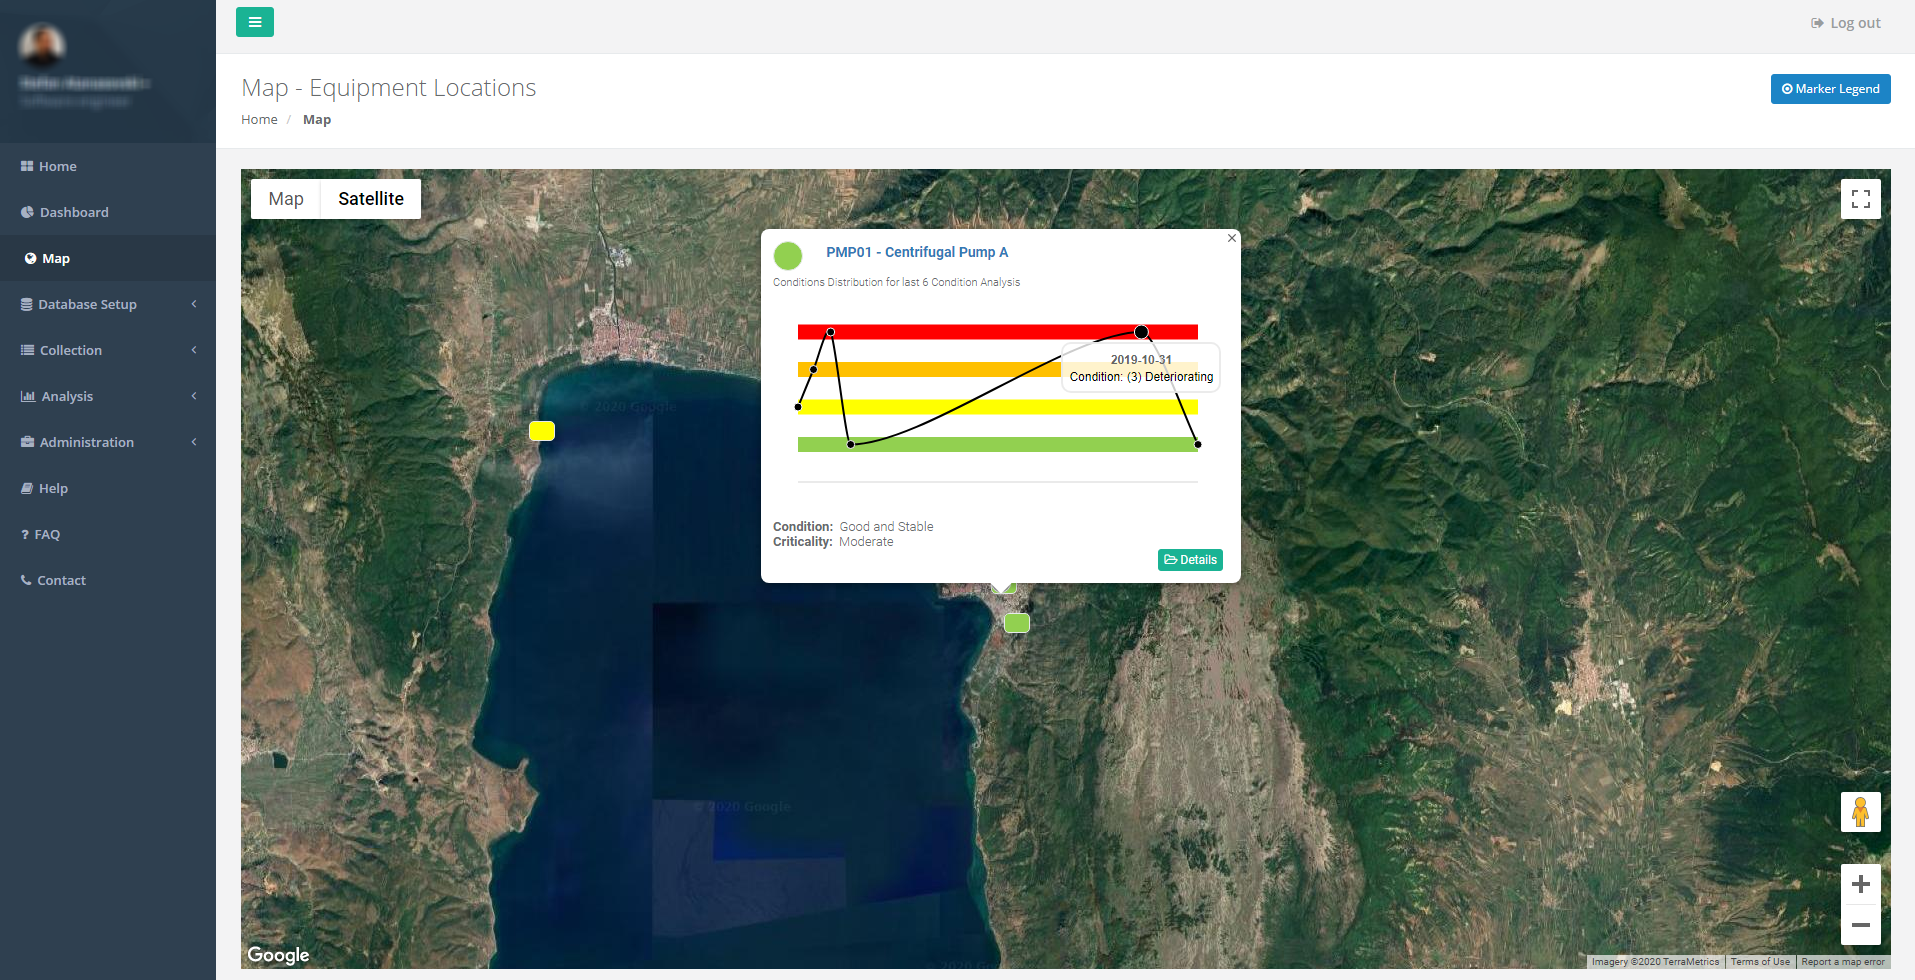
On mouse over, on each marker, will be displayed the description of the equipment/component. Clicking on the marker will open up an information box with trend chart for last six Condition Analysis, last Condition and Criticality. Also there is a button “Details” which will re-direct to Equipment Details page.
Marker Shapes and Colors
There are two different marker shapes:
Rounded rectangle - for equipment and components where at least one condition analysis has been made
Colors represents Last Analysis Condition
Circles - for equipment and components where there are no condition analysis
Colors represents worst overall limit breach from the last measurement
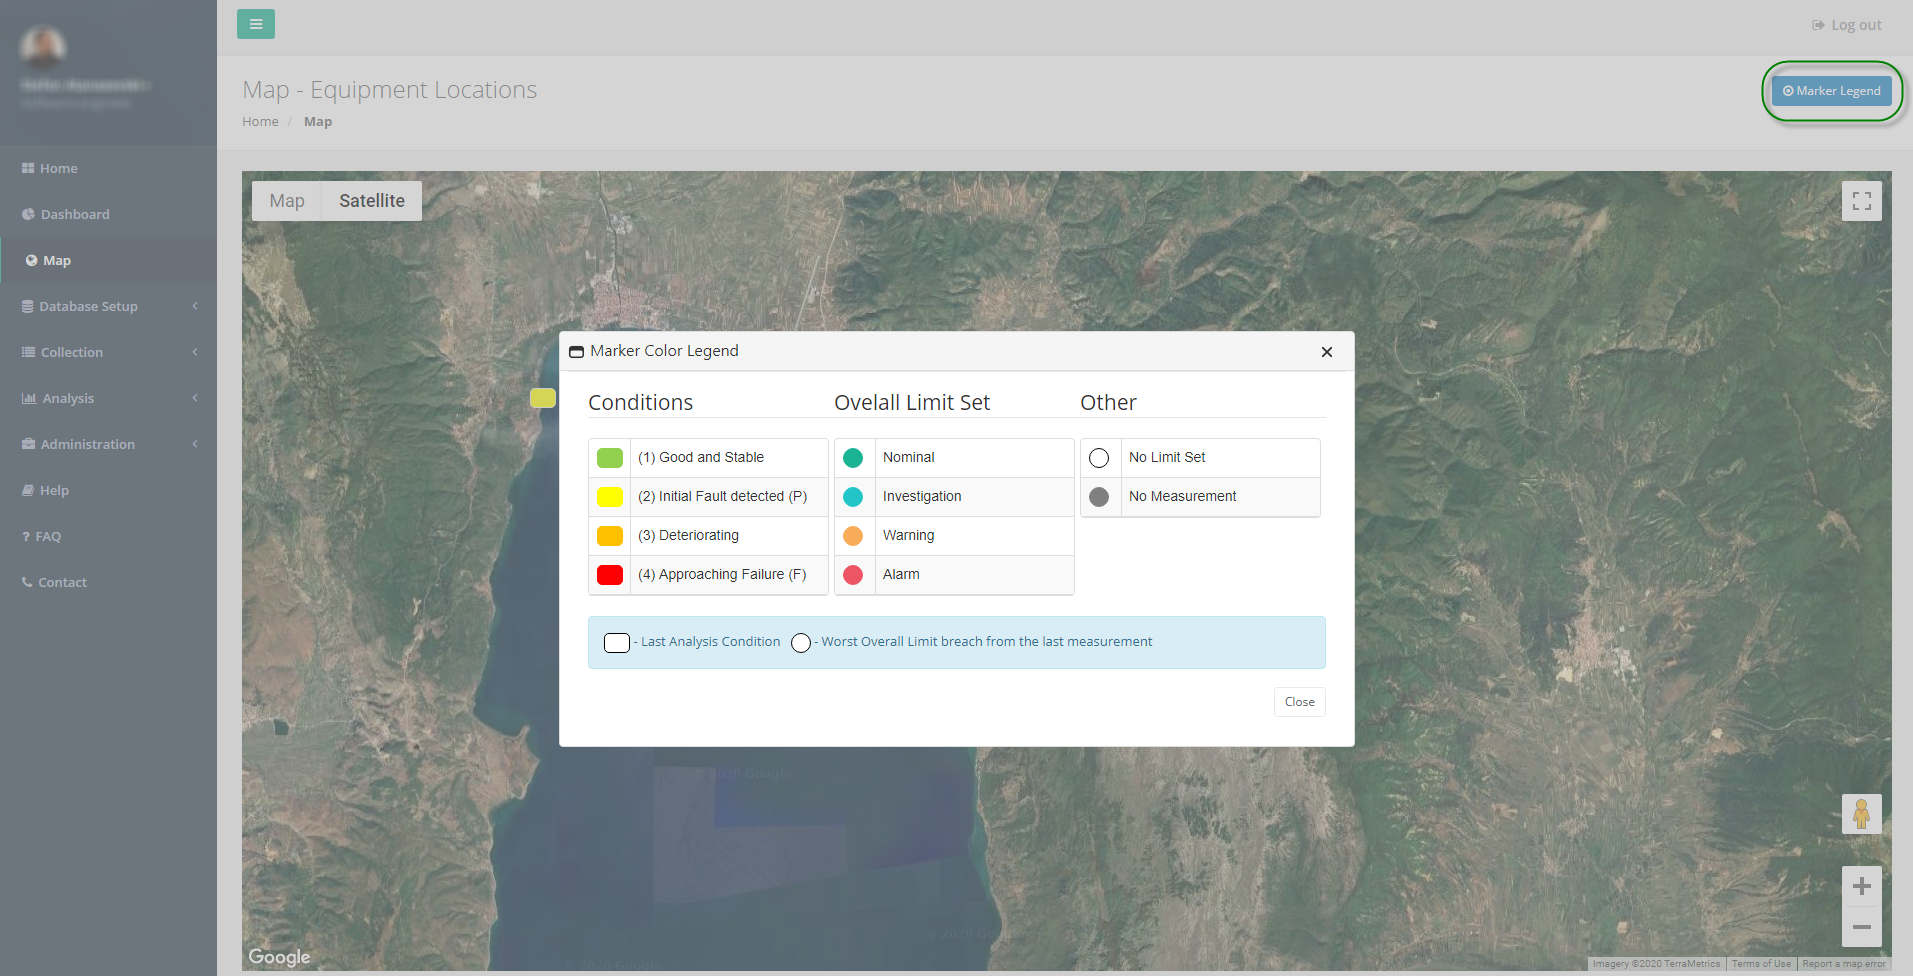
Since Condition colors are Client defined, detailed marker legend can be accessed by clicking on the “Marker Legend” button on the top right corner of the form