...
Analysis type – select one option from “Single Spectrum”, “Multi Spectra”, “Multi points”, “Waveform”, “Waterfall” and “Comparison”;
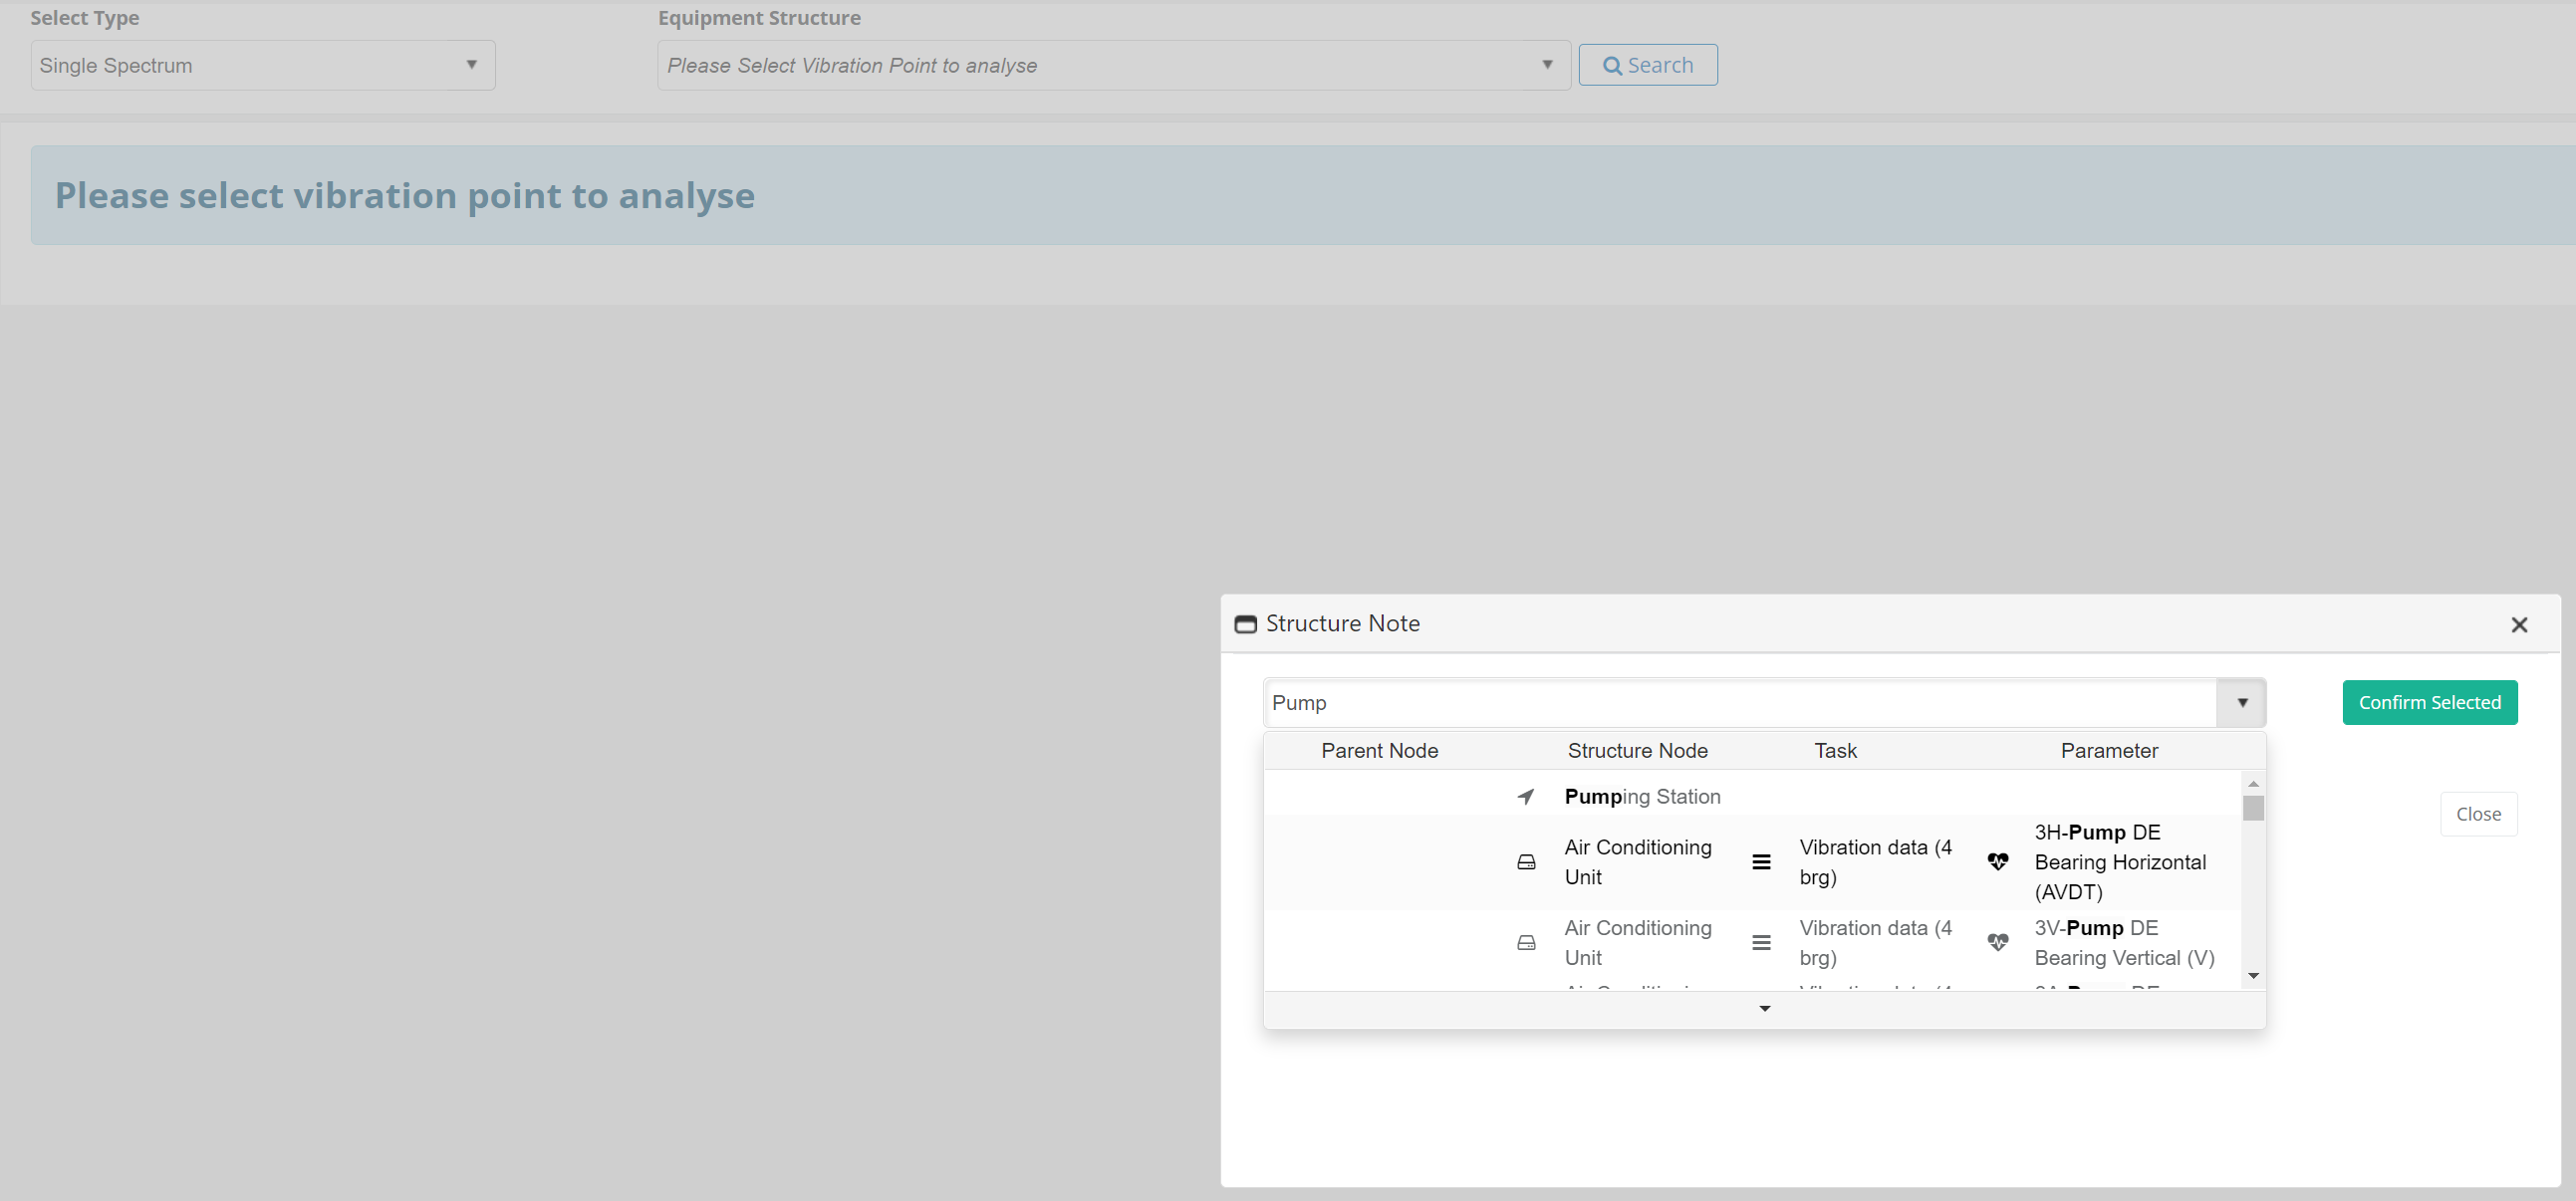
Structure – tree structure for easy access to the required parameter;
Search functionality - Click on “Search” button next to tree structure control. Pop-up appears with searchable drop-down control
Buttons to navigate to previous/next parameter in selected equipment;
Equipment – info on the equipment, task and parameter;
Analysis Summary – access to the module for writing findings and suggestions;
Menu with additional features:
Overall Value Summary Table
Analytics Assistant - more details on Analytics Assistant
Collected Route Data
Signal Processing Set
Notes – notes for the equipment and associated parameters;
Equipment library document XLS/X;
Equipment library document PDF;
...
RMS Trend Graph presents the trend of the RMS values for the collected data and includes the following options:
Graph – presenting RMS values for selected processing methods (5). Data behind can be accessed by clicking on any of the points on the trend. By default, the last data collected point is selected;
Point Measurements – List of all data collection for the selected point. Maximum The maximum number of different data collection per point is five. Measurement that is considered in the RMS trend and spectra below is ticked on the right side marked with “a” on the image. To change the measurement considered to other measurement measurements from the list just click on the target icon at the beginning of each row, marked with “b” on the image below;
Timeframe – Time span user want to review. This effects RMS trend;
Amplitude range – Two options are available automatic and custom. Automatic considers maximum and minimum RMS values collected for the timeframe selected and sets the range while custom allows user to set them manually;
Processing methods – All available processing methods for selected parameter. They can be turned on or off by clicking on corresponding button.
...
Spectra section lists all spectra, associated waveforms and analysis options for selected processing methods. Each processing method (acceleration, velocity, demodulation) have horizontal segment where it outlines spectrum and cursor options.
Set/Get 1xFreq for selected equipment (features available for all cursor types):Steps to analyse
Label Displaying 1xFreq value set for current equipment. 1xFreq can be set either from spectra or from Structure Identification form.
Get 1xFreq from the cursor - Set 1xFreq from the current cursor position
Find nearest highest point and interpolate frequency (from current cursor position)
Locate peak information
Clear 1xFreq
Insert 1xFreq manually. Insert value in the box and click on the “Manual entry” button
Default 1xFreq (from left to right)
Get default 1xFreq for current equipment (defined in Structure Identification form)
Set 1xFreq as default for current equipment
Delete default 1xFreq for current equipment
Show top 10 peaks - opens a pop-up table with top 10 peaks for current spectra.
...
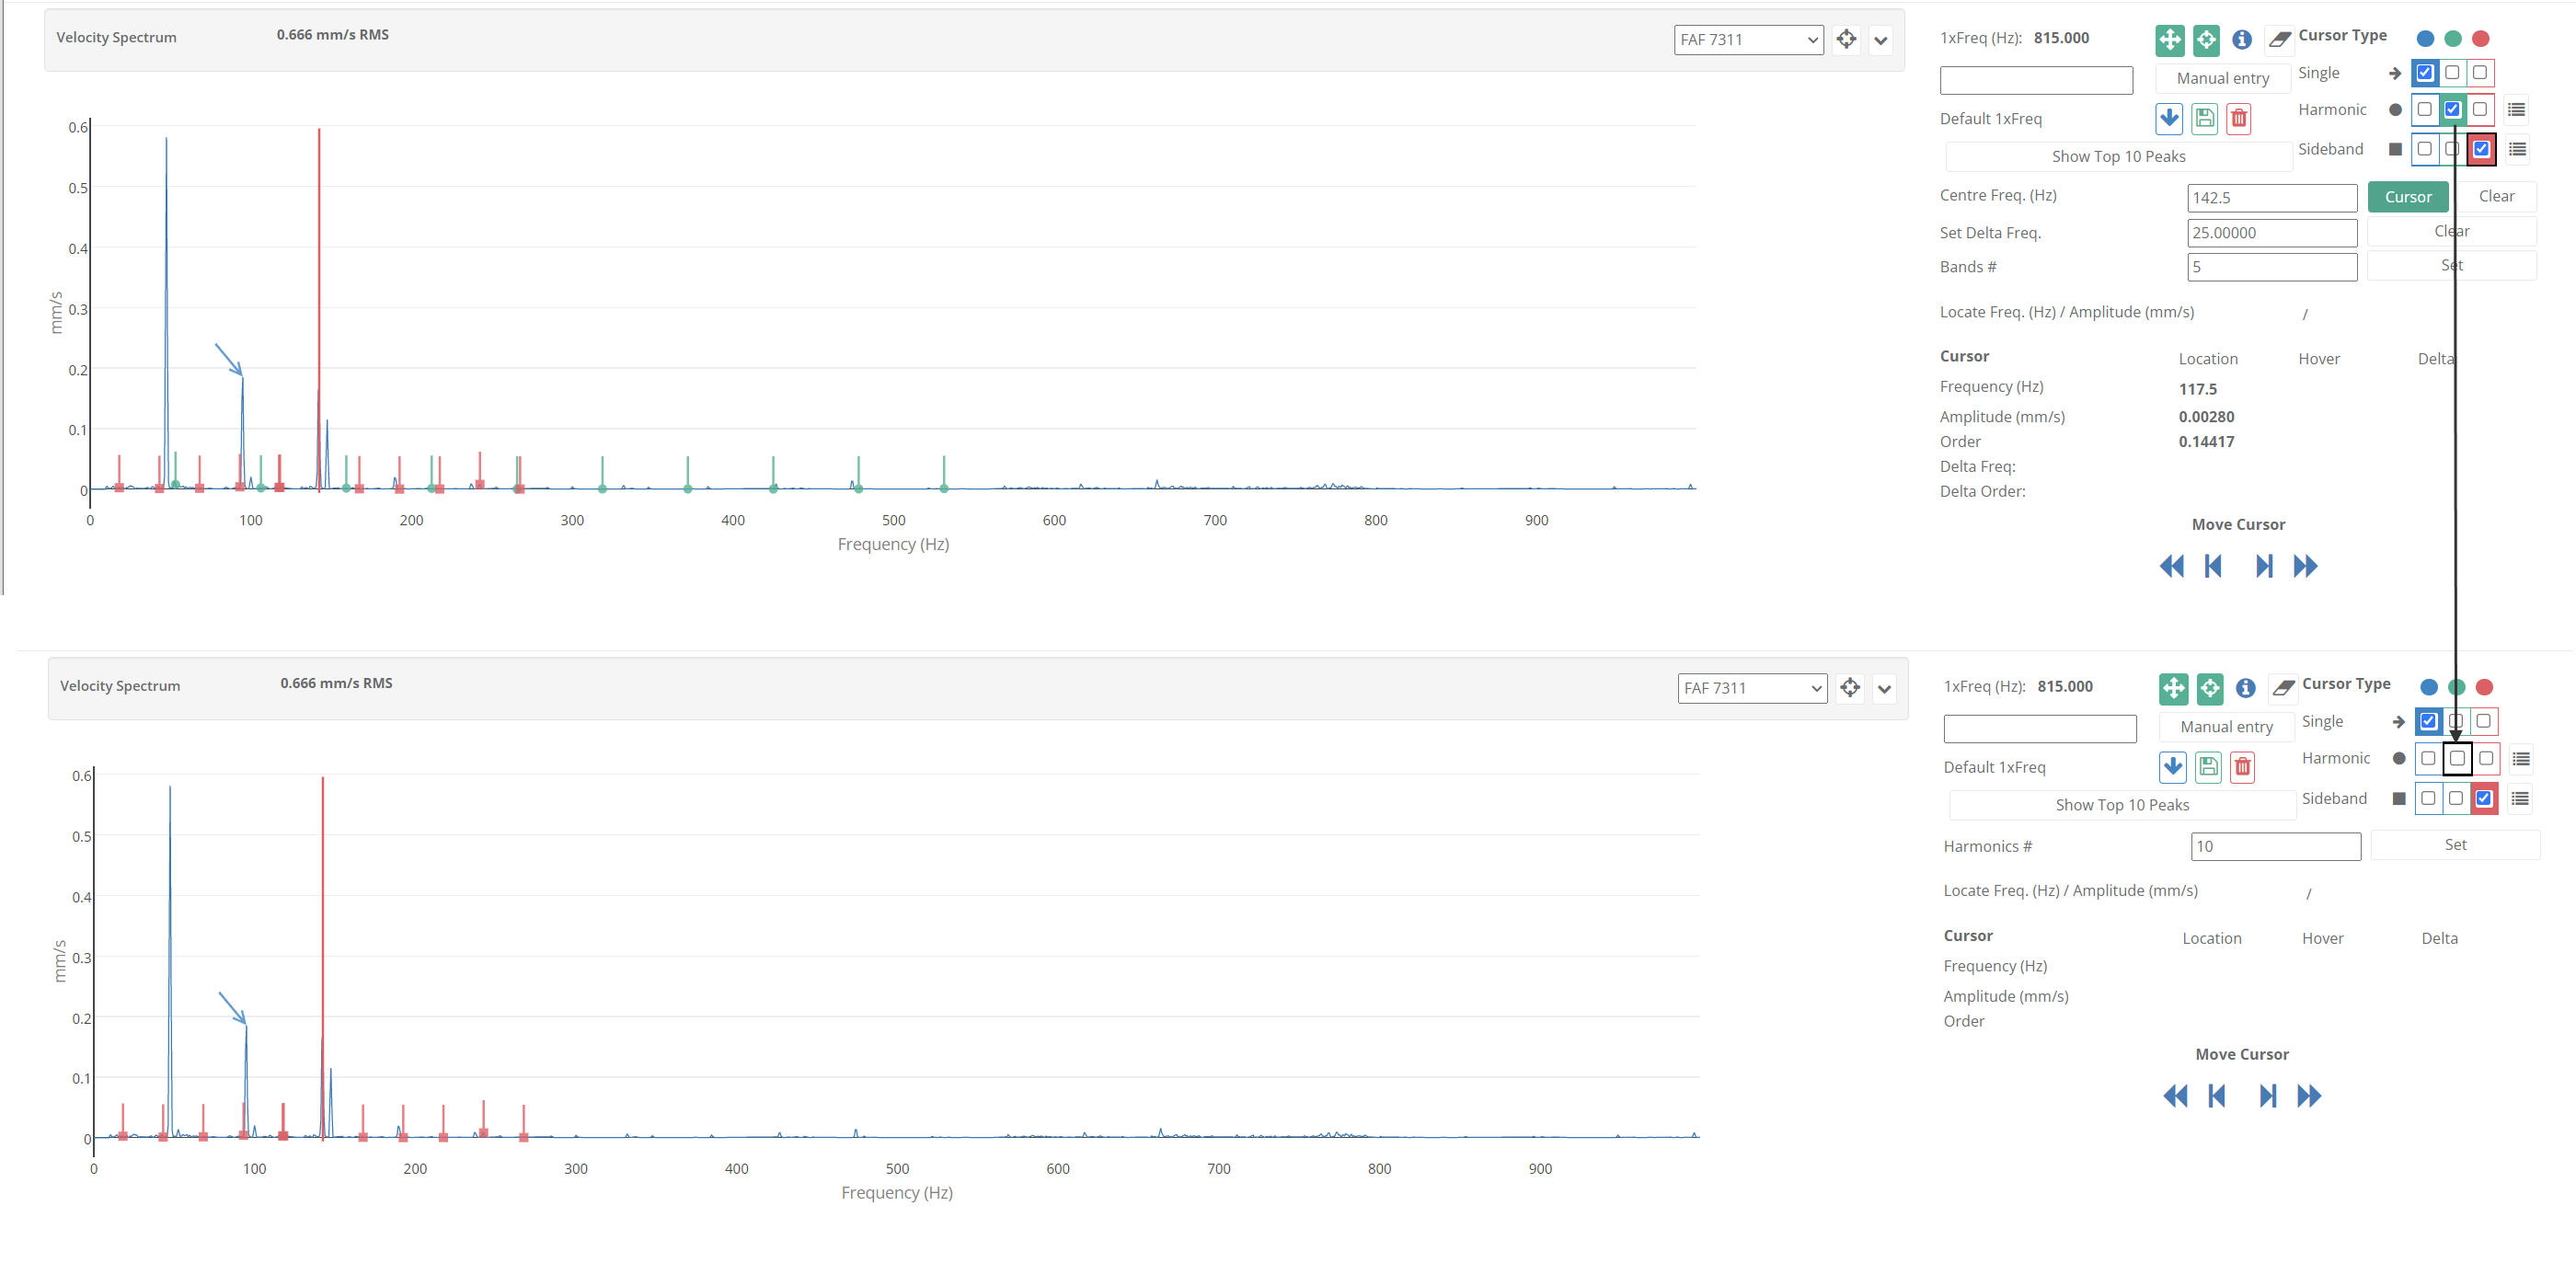
There are three types of cursor available for analysis: single, harmonic and sideband cursor. Each cursor type has a different marker on the spectra.
...
The analysis screen allows inserting of multiple cursors from one type (represented by a different color on the spectra) and a combination of multiple cursors from different types.
...
Steps to analyze collected data by single cursor:
Select cursor type – Single Cursorone of the colors from Single Cursor by clicking on the corresponding cell in the single cursor row;
Mark cursor on the spectrum
Click on the spectrum point ;
Click on “Get from cursor” button – this sets 1xFreq from cursor;
Cursor can be added manually – add number in the text box and click on the “Manual entry” button;
“Locate Peak” – locates nearest highest point and interpolates frequency based on selected peak point. This frequency is set as 1xFreq.- this will automatically show an arrow pointer with the selected color;
By hovering over the spectrum with the mouse pointer cursor table is updated accordingly showing frequency, amplitude, order for location, hover and delta;
“Get default” button will bring default 1xFrequency for the equipment
“Show Top 10 Peaks” button will mark top 10 peaks on the spectrum and will present related info table under the “Move Cursor” functionality;
“Move Cursor” helps navigating navigate with the cursor in the spectrum. Inside controls will move the cursor by one point in the respective direction while outside controls will move it by five points
If “Show In Report” check box is ticked that spectrum will be present in the report;
Save icon grabs a print of the spectrum (including the cursors or zoomed in or out) and saves it as evidence for the corresponding analysis
...
Steps to analyze collected data by harmonic cursor (only different from single cursor):
Select cursor type – Harmonic Cursorone of the colors from Harmonic Cursor by clicking on the corresponding cell in a single cursor row;
Mark cursor on the spectrum
Click “Get from cursor” button
Set number of harmonics (default is 10)
- this will automatically show the select position of the first harmonic and display all other harmonics on the spectra. Harmonics would be marked on the spectrum by orange dots
Table outlining harmonics details will be presented on the right
...
dots with a slight vertical line with selected color
Set number of harmonics (default is 10)
View inserted harmonics cursors - opens pop-up table outlining harmonics details
“Move Cursor” helps navigate with the first harmonic in the spectrum. Inside controls will move the cursor by one point in the respective direction while outside controls will move it by five points
...
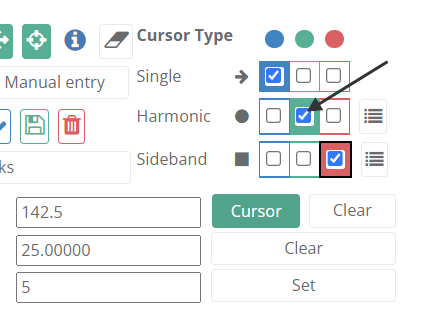
Steps to analyze collected data by sideband cursor (only different from single cursor):
Select cursor type – Sideband Cursorone of the colors from Sideband Cursor by clicking on the corresponding cell in a single cursor row;
Mark central frequency on the spectrum. Central frequency would be marked on the spectrum with a vertical line with the selected color.
Click the “Cursor” button next to the “Centre Freq.” text box to confirm the central frequency
Mark delta on the spectrum
Click “Cursor” button next to the “Set Delta” text box
Set number of bands
Central frequency - this will automatically calculate delta frequency based on the position of the cursor and selected central frequency and display all sideband cursors on the spectra.
Sideband cursors would be marked on the spectrum by rectangles with a slight vertical line
Bands would be marked on the spectrum with orange dots
Table outlining bands details will be presented on the right
...
with selected color
Set number of bands
Clear Delta frequency - this will clear all sideband cursors and allow the user to redefine delta frequency.
Clear central frequency - this will clear all markers related to the selected sideband cursor and allow the user to re-set again.
View inserted sideband cursors - opens pop-up table outlining sideband details
“Move Cursor” helps navigate with both central frequency and delta frequency on the spectrum. Inside controls will move the cursor by one point in the respective direction while outside controls will move it by five points
...
Each inserted cursor can be further managed by the selected corresponding cell in the “Cursor Type / Color Matrix”.
Steps to delete inserted cursor:
Click on the “checked” sign on one of the existing cursors in the “Cursor Type / Color Matrix”.
Confirmation is required for removing cursor from the spectra
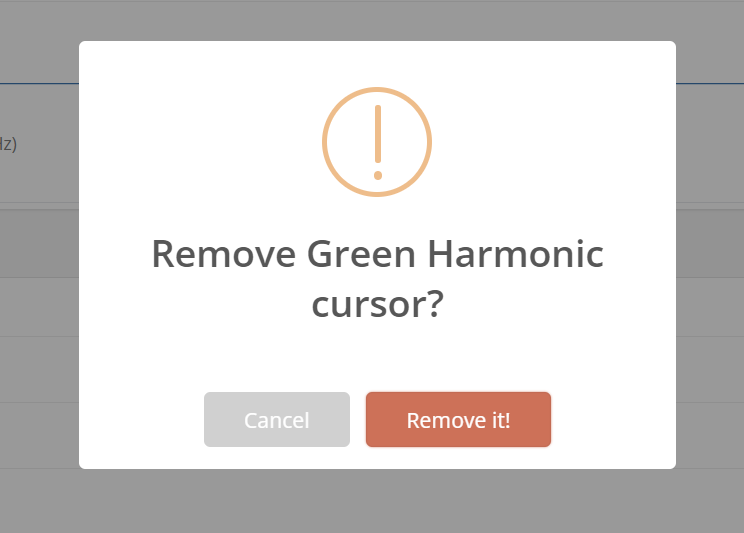
By confirming, all cursor markers will be removed from the spectra
Pending on the parameter settings (if the waveform is selected for collection or not) row waveform section is visible at the bottom of the analysis module. Here use can:
1) listen to waveform collected during recording. Option for
2) download is also available.
...
Additional Analysis features
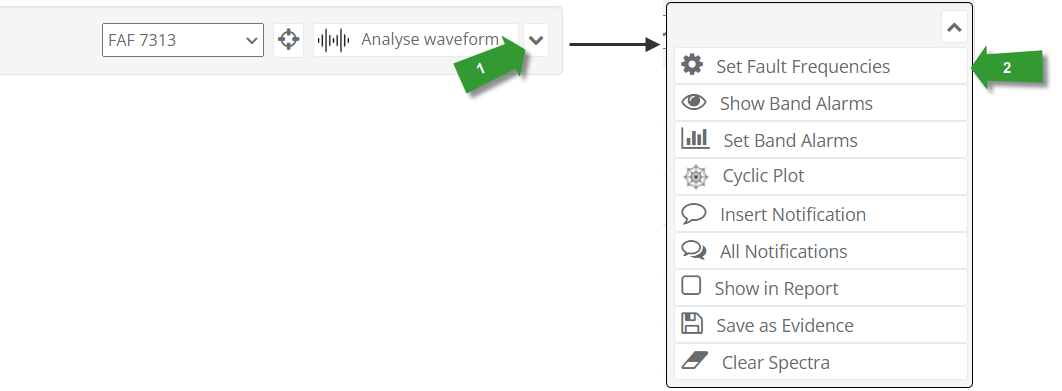
Fault Frequencies
...
...
List of linked Fault Frequencies codes (both Bearing and Gearbox)
...
Click Icon to display frequencies
...
Click Icon to manage links with both types of Frequencies
Steps to display Fault Frequecies Frequencies on the spectra:
Select one of the previously linked fault frequencies (listed by code)
Click on the icon next to the list to display the frequencies list
All frequencies are clickable. Clicking on one of them will display them on the spectra
...
Steps to link Fault Frequencies (same for both Bearing and Gearbox):
Click on the icon on the left to open menu
Click on the Icon to open form
Search for the required Frequencies (either Bearing or Gearbox)
Click “Link Type” to link selected one with the current parameter. Linked Frequencies types will be listed in the table bellow.
...
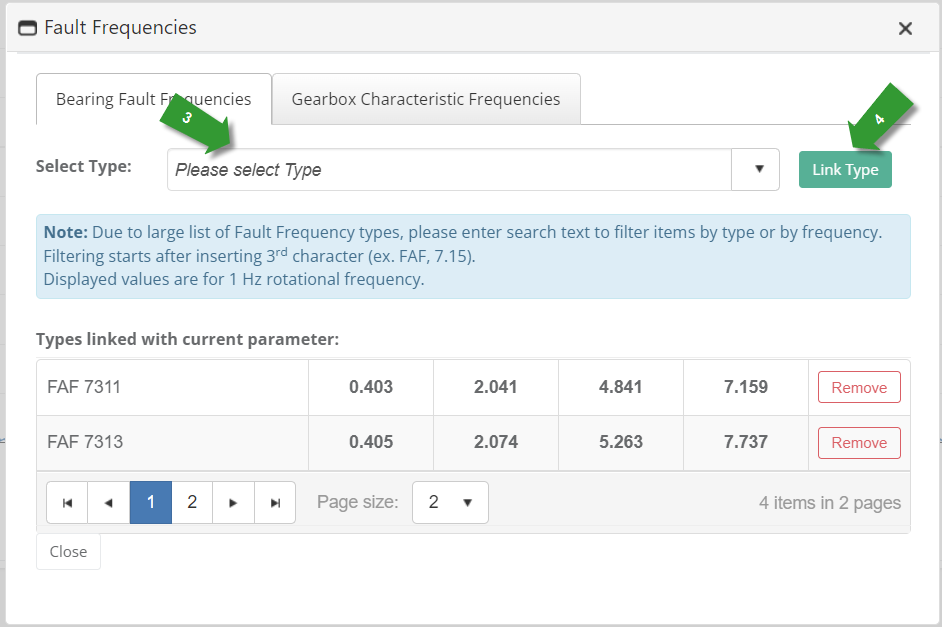
There is also an option to remove linked Frequencies by clicking “Remove” button on the right end at each table row.
...
Band Alarms
...
Display Show/Hide Band Alarms on the spectra (if there are created or linked band alarm frequencies with current parameter)
Click Icon to manage related Band Alarms
...
Option to select which Band Alarm Frequency ranges to be shown on the spectra;
Functionalities for parameter specific Band Alarm Frequency Range
Edit - Amend existing one;
Delete
...
Analyse Analyze Normal Waveform
...
If option to store Normal Waveform for current parameter and for specific paremeter parameter type is marked in the parameter setting form, icon for Analyse Analyze Waveform will be visible. Click on the icon to open form for analyse analyze normal waveform.
Steps to analyse analyze normal waveform:
Mark cursor on the spectrum by clicking on the spectrum point;
Check “Show delta harmonics”:
By default there are 5 delta harmonics set, but this can be changed by the user;
Click on “Set” button to set number on delta harmonics.
Mark Delta by clicking on the spectrum point. This will automatically display as many harmonics as they are specified in previous step and information for delta time and delta frequency;
By hovering over the spectrum with the mouse pointer cursor table is updated accordingly showing time, amplitude, order for location, hover and delta;
“Move Cursor” helps navigating with cursor in the spectrum. Inside controls will move cursor by one point in respective direction while outside controls will move it by five points;
Option to change y-axis unit;
“Save as Evidence” button grabs a print of the spectrum (including the cursors or zoomed in or out) and saves it as evidence for the corresponding analysis
...
Click “Get” button to get 1xFreq from Equipment setup (if it’s defined);
Option to manually insert 1xFred:
Insert 1xFreq value;
Click “Manual entry” to set - cyclic plot will be re-drawn
Option to change unit;
“Save as Evidence” button grabs a print of the the plot and saves it as evidence for the corresponding analysis;
By hovering over the spectrum with the mouse pointer cursor table is updated accordingly showing amplitude and angle.
...
Spectra Notifications
Steps to insert new notification:
Select frequency on the spectra where Notification will be displayed
Click on “Insert Notification”
Insert notification text
Click “Save Change” to save notification and display it on the spectra
...
Manage all created notifications for current parameters spectra:
Click on “All Notifications”
Show/Hide Notifications on the spectra (if there are created notifications for current parameter spectra)
Option to select which Notifications to be shown on the spectra
Functionalities for Notification list
Edit - Amend existing one;
Delete
...
Show in Report
...
If selected, current spectra will be displayed in the reports.
...
Save as Evidence
...
Save current spectra as image and relate it with condition analysis.
Clear Spectra
...
Clear all markers related with cursors, notifications, fault frequencies and alarms.
Condition Analysis
Condition Analysis or Analysis summary can be accessed from the header of the Analyse module by clicking on the “Analysis Summary” icon located on the top right corner.
...