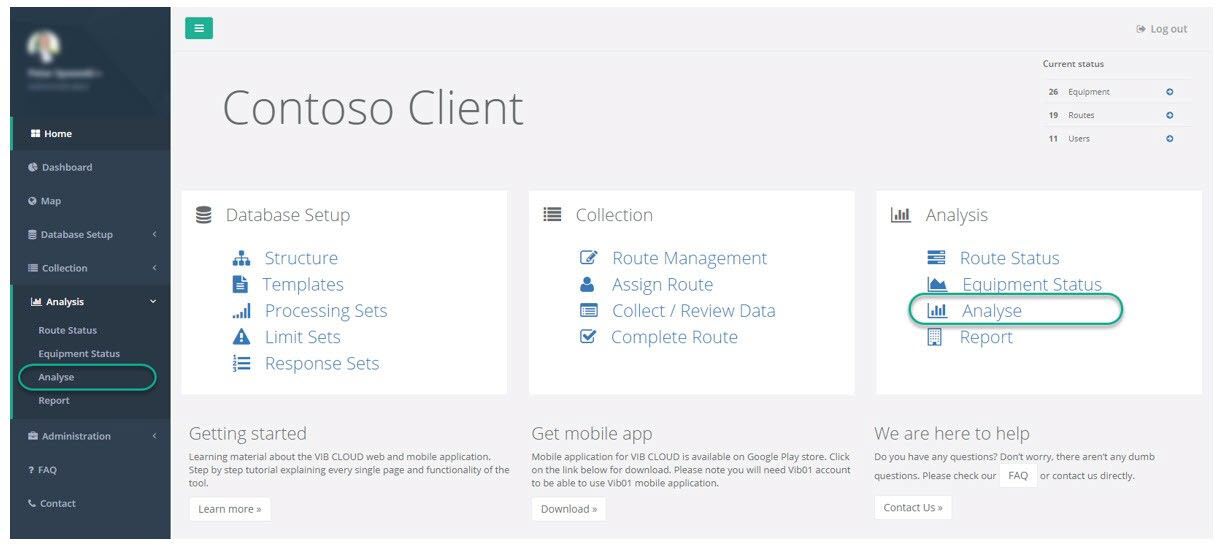
“Analyse” module is created as a tool for vibration analyst user. It offers different analysis types and option to record findings as well as suggesting appropriate actions to the client. Can be accessed from the home screen by clicking “Analyse” from the “Analysis” section or from the menu on the left within the same section.
Analyse module is fragmented into three parts:
Header;
RMS trend and
Spectra.
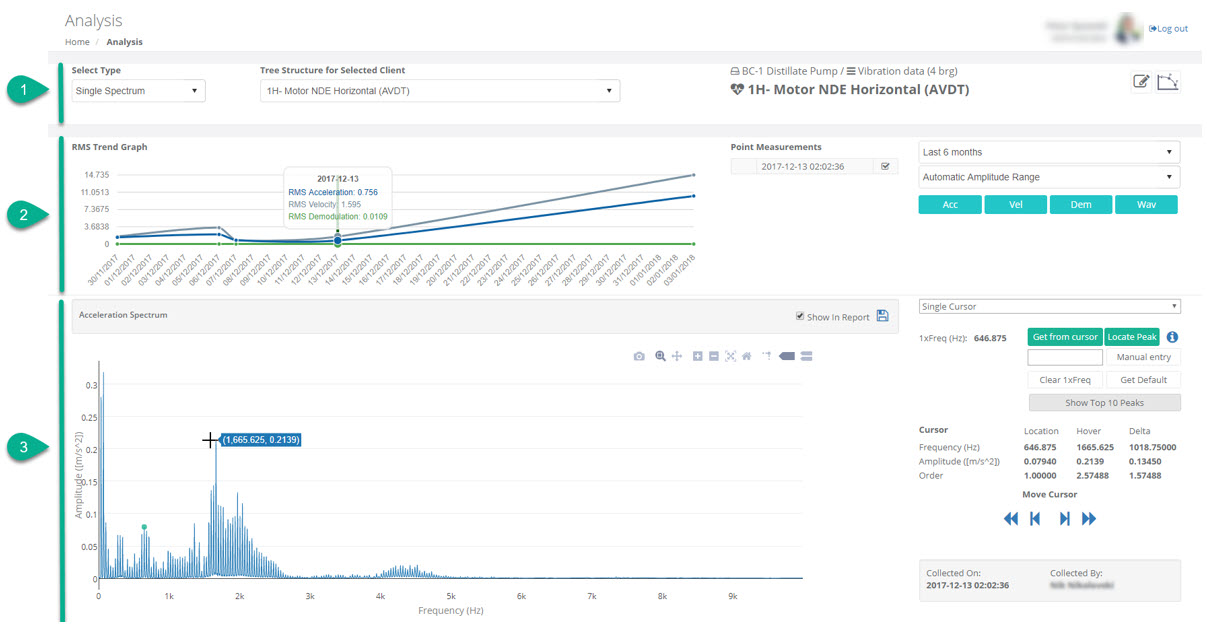
Header includes following features:
Analysis type – select one option from “Single Spectrum”, “Multi Spectra”, “Multi points”, “Waveform”, “Waterfall” and “Comparison”;
Structure – tree structure for easy access to the required parameter;
Buttons to navigate to previous/next parameter in selected equipment;
Equipment – info on the equipment, task and parameter;
Analysis Summary – access to the module for writing findings and suggestions;
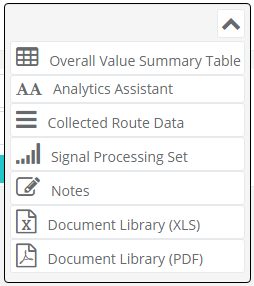
Menu with additional features:
Overall Value Summary Table
Analytics Assistant - more details on Analytics Assistant
Collected Route Data
Signal Processing Set
Notes – notes for the equipment and associated parameters;
Equipment library document XLS/X;
Equipment library document PDF;

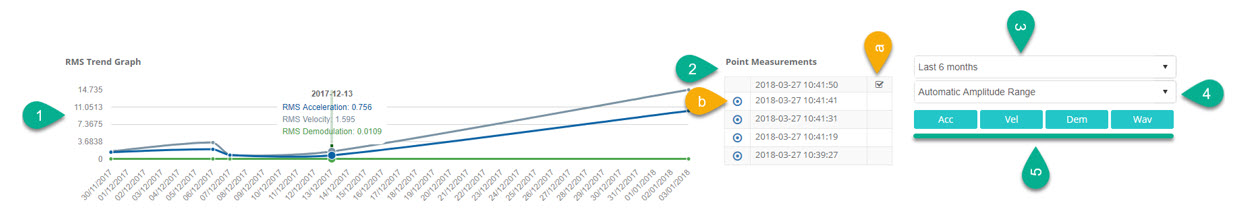
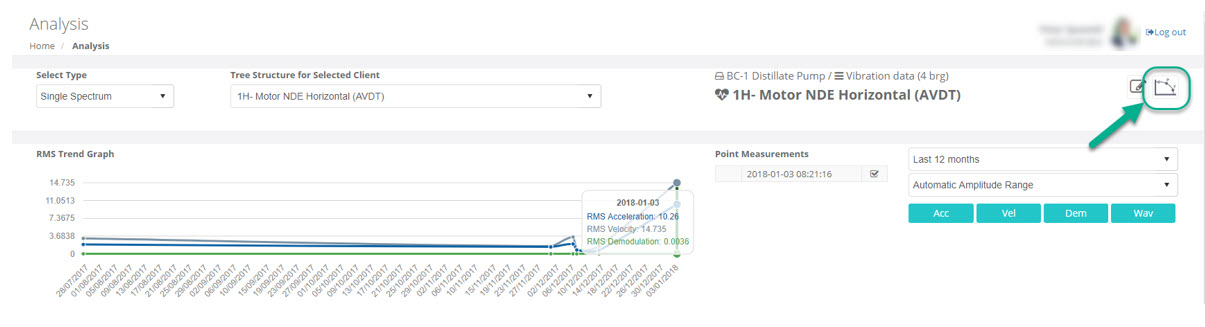
RMS Trend Graph presents trend of the RMS values for the collected data and includes following options:
Graph – presenting RMS values for selected processing methods (5). Data behind can be accessed by clicking on any of the points on the trend. By default, last data collected point is selected;
Point Measurements – List of all data collection for the selected point. Maximum number of different data collection per point is five. Measurement that is considered in the RMS trend and spectra below is ticked on the right side marked with “a” on the image. To change measurement considered to other measurement from the list just click on the target icon at the beginning of each row, marked with “b” on the image below;
Timeframe – Time span user want to review. This effects RMS trend;
Amplitude range – Two options are available automatic and custom. Automatic considers maximum and minimum RMS values collected for timeframe selected and sets the range while custom allows user to set them manually;
Processing methods – All available processing methods for selected parameter. They can be turned on or off by clicking on corresponding button.
Spectra section lists all spectra, associated waveforms and analysis options for selected processing methods. Each processing method (acceleration, velocity, demodulation) have horizontal segment where it outlines spectrum and cursor options.
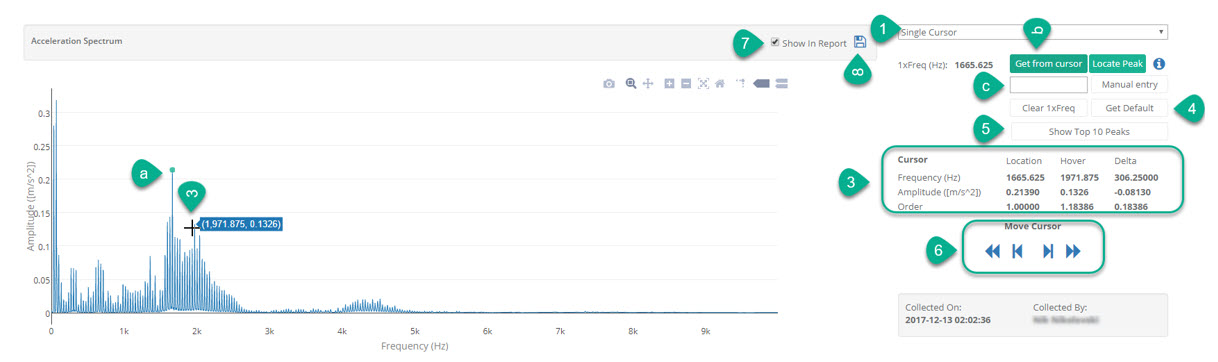
Steps to analyse collected data by single cursor:
Select cursor type – Single Cursor;
Mark cursor on the spectrum
Click on the spectrum point;
Click on “Get from cursor” button – this sets 1xFreq from cursor;
Cursor can be added manually – add number in the text box and click on the “Manual entry” button;
“Locate Peak” – locates nearest highest point and interpolates frequency based on selected peak point. This frequency is set as 1xFreq.
By hovering over the spectrum with the mouse pointer cursor table is updated accordingly showing frequency, amplitude, order for location, hover and delta;
“Get default” button will bring default 1xFrequency for the equipment
“Show Top 10 Peaks” button will mark top 10 peaks on the spectrum and will present related info table under the “Move Cursor” functionality;
“Move Cursor” helps navigating with cursor in the spectrum. Inside controls will move cursor by one point in respective direction while outside controls will move it by five points
If “Show In Report” check box is ticked that spectrum will be present in the report;
Save icon grabs a print of the spectrum (including the cursors or zoomed in or out) and saves it as evidence for the corresponding analysis
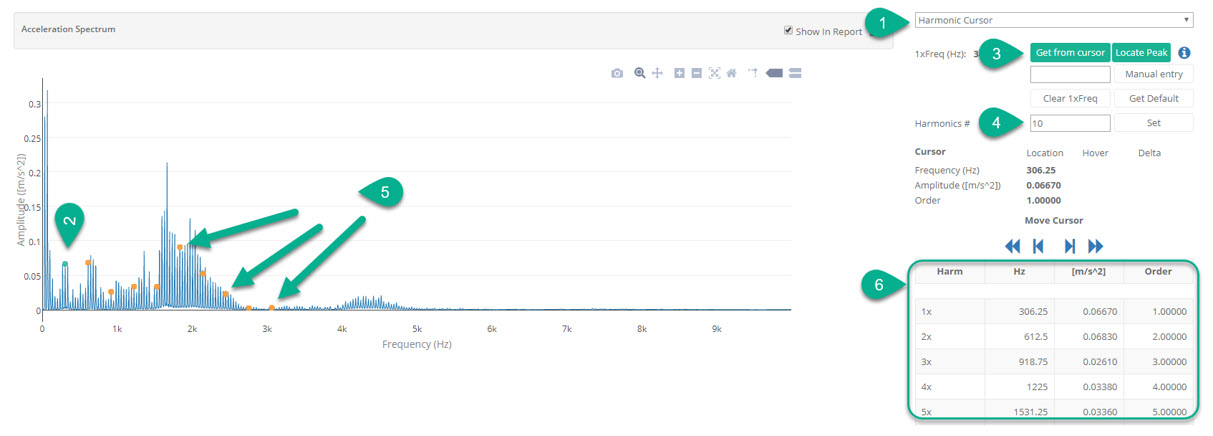
Steps to analyse collected data by harmonic cursor (only different from single cursor):
Select cursor type – Harmonic Cursor;
Mark cursor on the spectrum
Click “Get from cursor” button
Set number of harmonics (default is 10)
Harmonics would be marked on the spectrum by orange dots
Table outlining harmonics details will be presented on the right
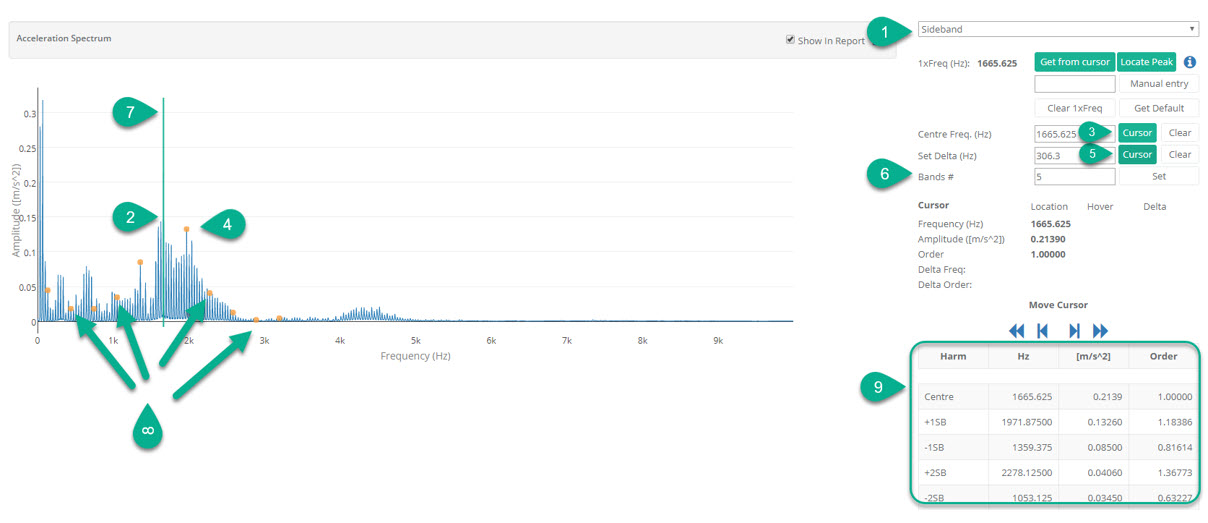
Steps to analyse collected data by sideband cursor (only different from single cursor):
Select cursor type – Sideband Cursor;
Mark central frequency on the spectrum
Click “Cursor” button next to the “Centre Freq.” text box
Mark delta on the spectrum
Click “Cursor” button next to the “Set Delta” text box
Set number of bands
Central frequency would be marked on the spectrum with vertical line
Bands would be marked on the spectrum with orange dots
Table outlining bands details will be presented on the right
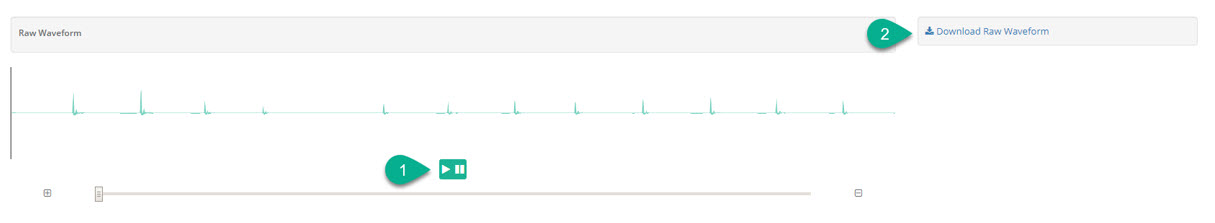
Pending on the parameter settings (if waveform selected for collection or not) row waveform section is visible at the bottom of the analysis module. Here use can 1) listen waveform collected during recording. Option for 2) download is also available.
Additional Analysis features
Fault Frequencies

List of linked Fault Frequencies codes (both Bearing and Gearbox)
Click Icon to display frequencies
Click Icon to manage links with both types of Frequencies
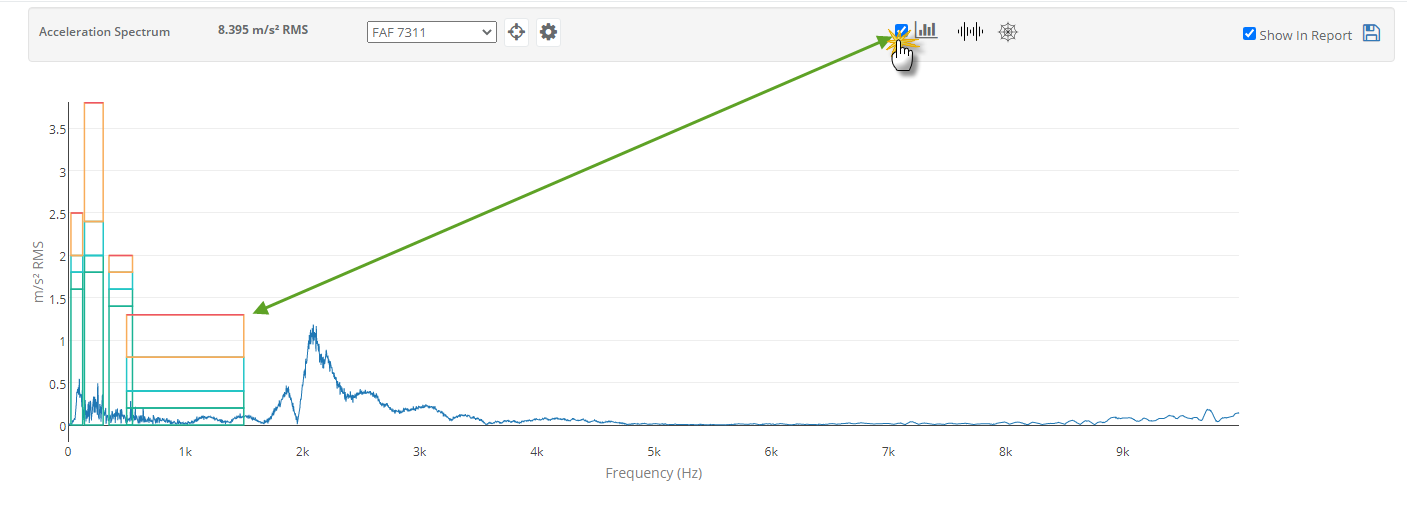
Steps to display Fault Frequecies on the spectra:
Select one of previously linked fault frequencies (listed by code)
Click on the icon next to the list to display frequencies list
All frequencies are clickable. Clicking on one of them will display them on the spectra
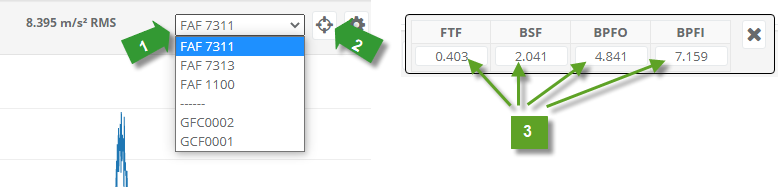
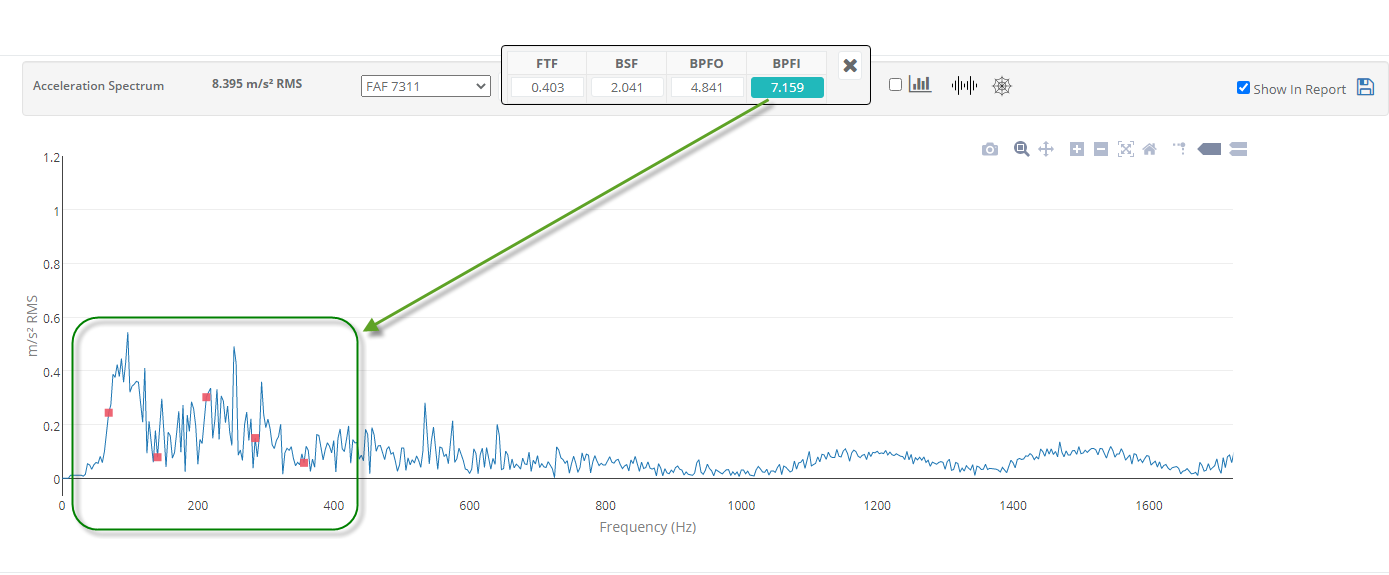
Please Note: 1xFreq must be defined in orde to show them on the spectra.
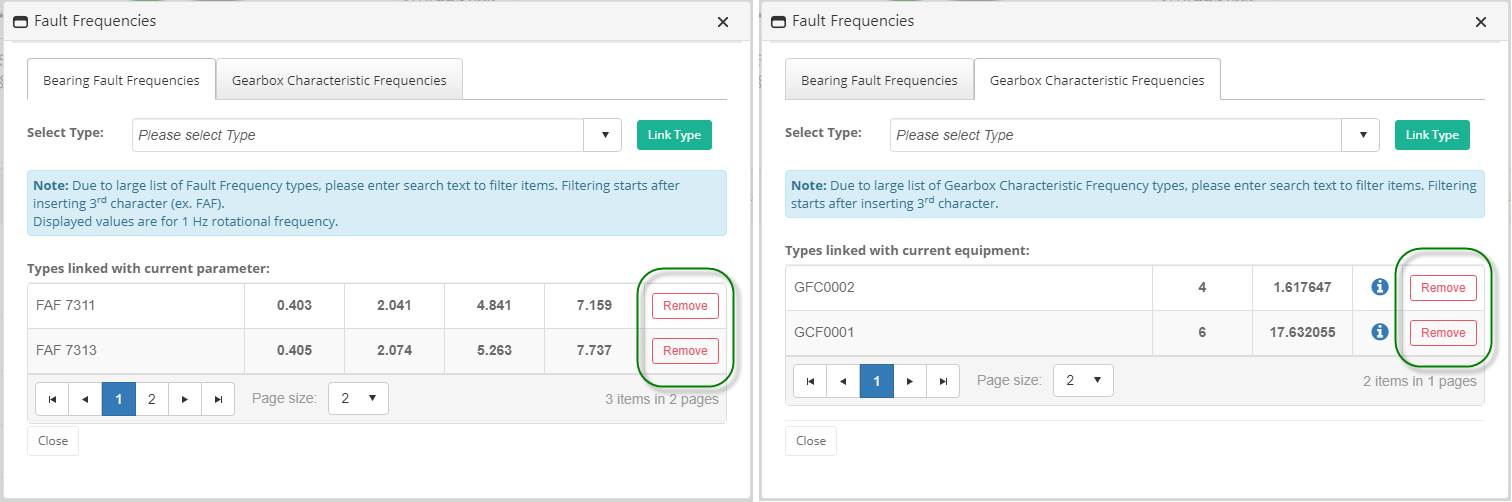
Steps to link Fault Frequencies (same for both Bearing and Gearbox):
Click on the Icon to open form
Search for the required Frequencies (either Bearing or Gearbox)
Click “Link Type” to link selected one with the current parameter. Linked Frequencies types will be listed in the table bellow.
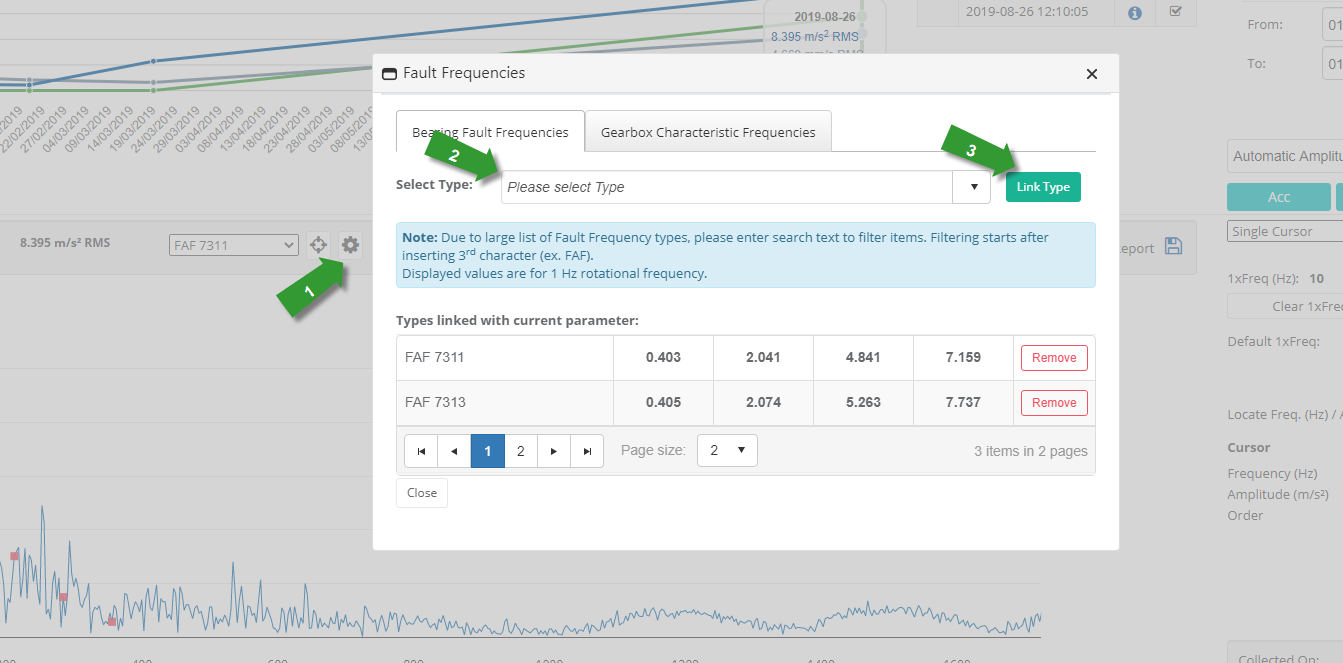
There is also an option to remove linked Frequencies by clicking “Remove” button on the right end at each table row.
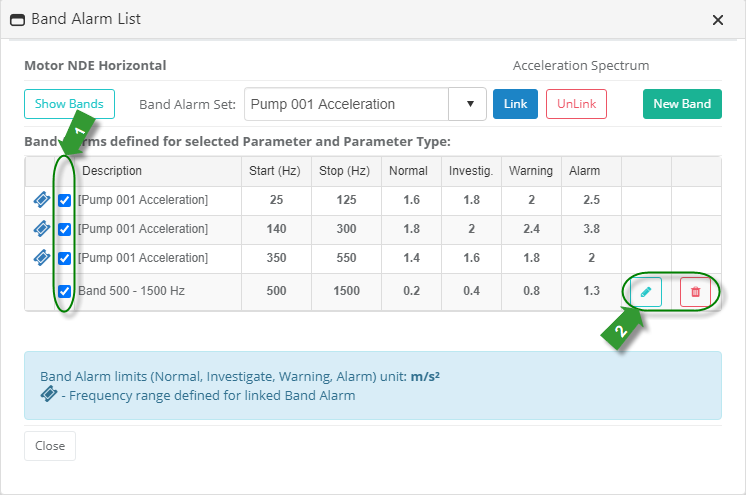
Band Alarms

Display Band Alarms on the spectra (if there are created or linked band alarm frequencies with current parameter)
Click Icon to manage related Band Alarms
Steps to link Band Alarm Set:
Select Band Alarm Set from the list;
Click on “Link” button to display all band alarm sets frequency ranges. Frequency ranges will be displayed in the table bellow with marker at the beggining of each row.
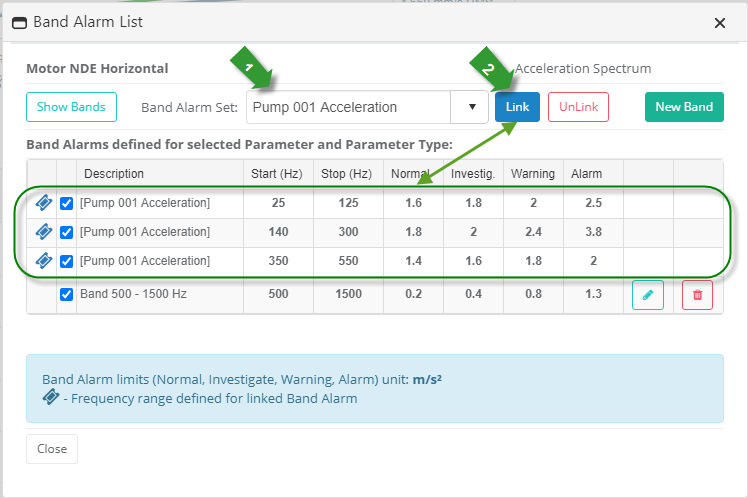
Note: If Band Alarm Set is not required for current paremeter there is an option to remove the link by clicking on the “UnLink” button.
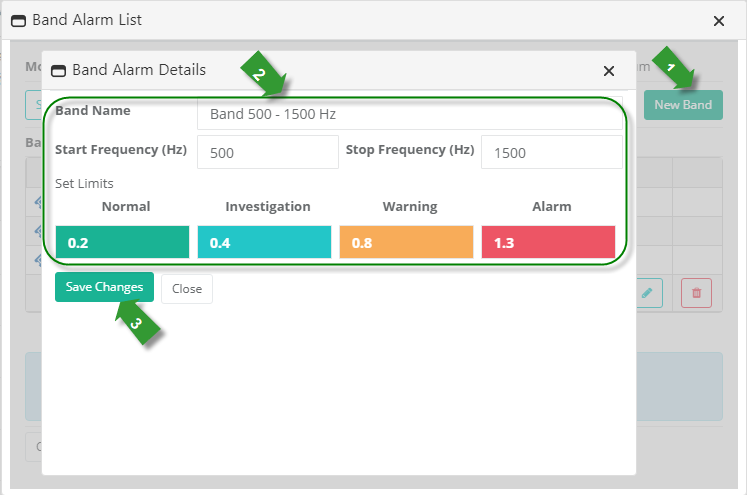
Steps to create parameter specific Band Alarm Frequency Range:
Click on “New Band” button to open form for creating new band alarm frequency range;
Insert values in form fields:
Band Name
Start and Stop Frequency
Values for Normal, Investigation, Warning and Alarm
Click on “Save Changes” button to save inserted values
Functionalities in the list of band alarms:
Option to select which Band Alarm Frequency ranges to be shown on the spectra;
Functionalities for parameter specific Band Alarm Frequency Range
Edit - Amend existing one;
Delete
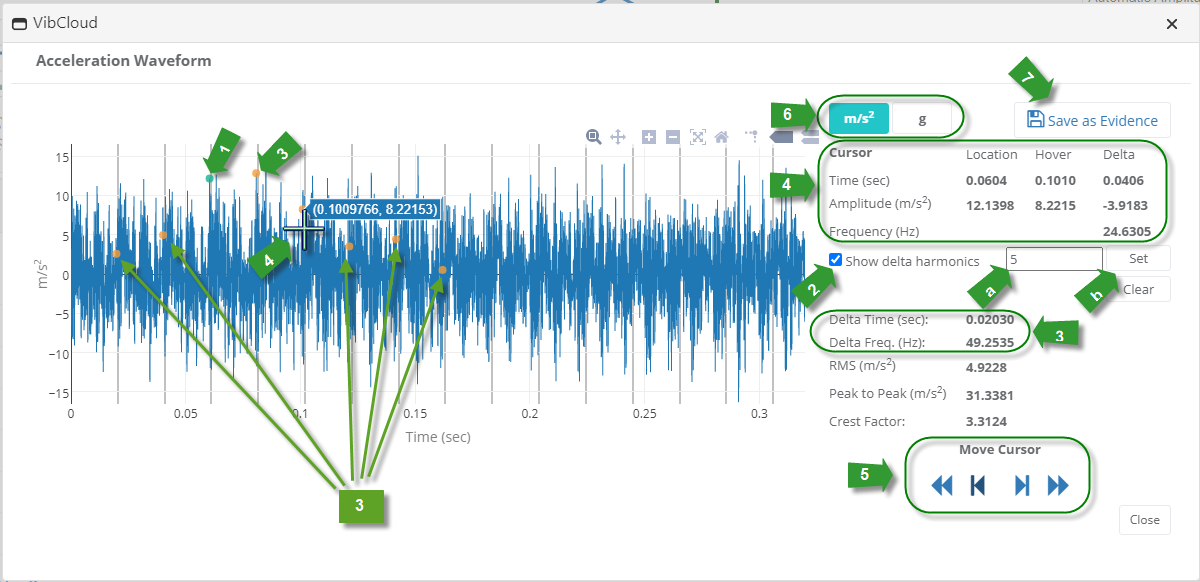
Analyse Normal Waveform

If option to store Normal Waveform for current parameter and for specific paremeter type is marked in the parameter setting form, icon for Analyse Waveform will be visible. Click on the icon to open form for analyse normal waveform.
Steps to analyse normal waveform:
Mark cursor on the spectrum by clicking on the spectrum point;
Check “Show delta harmonics”:
By default there are 5 delta harmonics set, but this can be changed by the user;
Click on “Set” button to set number on delta harmonics.
Mark Delta by clicking on the spectrum point. This will automatically display as many harmonics as they are specified in previous step and information for delta time and delta frequency;
By hovering over the spectrum with the mouse pointer cursor table is updated accordingly showing time, amplitude, order for location, hover and delta;
“Move Cursor” helps navigating with cursor in the spectrum. Inside controls will move cursor by one point in respective direction while outside controls will move it by five points;
Option to change y-axis unit;
“Save as Evidence” button grabs a print of the spectrum (including the cursors or zoomed in or out) and saves it as evidence for the corresponding analysis
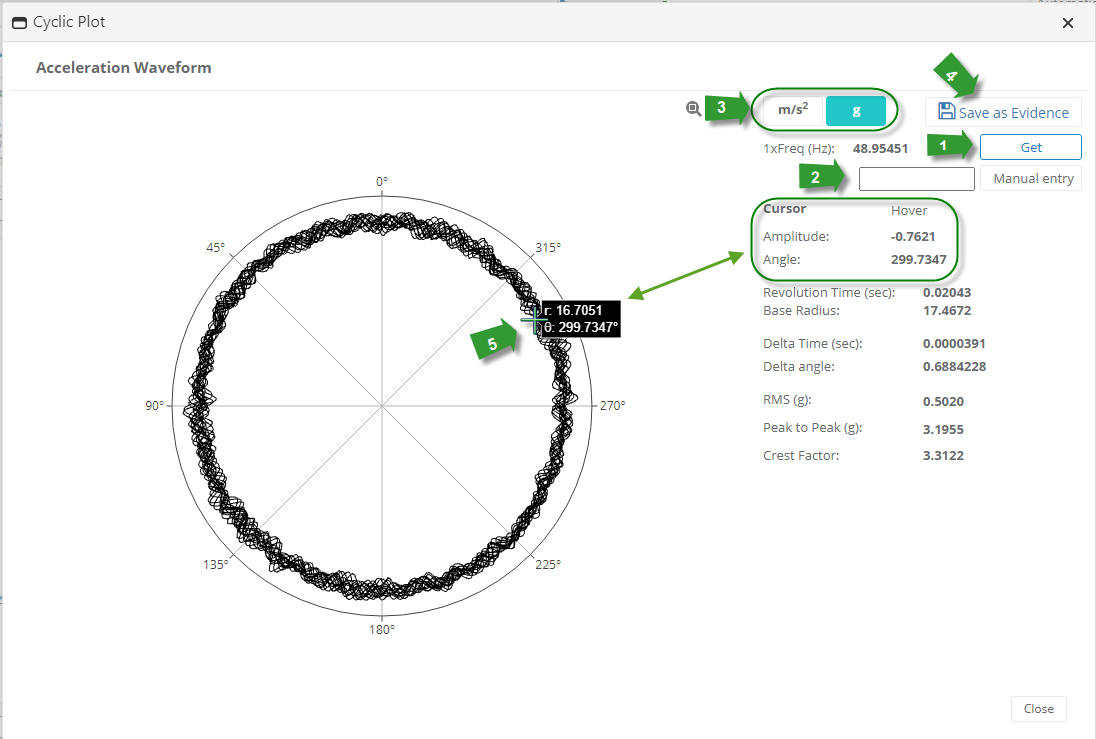
Cyclic Plot

If option to store Normal Waveform for current parameter and for specific paremeter type is marked in the parameter setting form, icon for Cyclic Plot will be visible. Click on the icon to open form for cyclic plot preview.
Steps for preview Cyclic Plot:
Click “Get” button to get 1xFreq from Equipment setup (if it’s defined);
Option to manually insert 1xFred:
Insert 1xFreq value;
Click “Manual entry” to set - cyclic plot will be re-drawn
Option to change unit;
“Save as Evidence” button grabs a print of the the plot and saves it as evidence for the corresponding analysis;
By hovering over the spectrum with the mouse pointer cursor table is updated accordingly showing amplitude and angle.
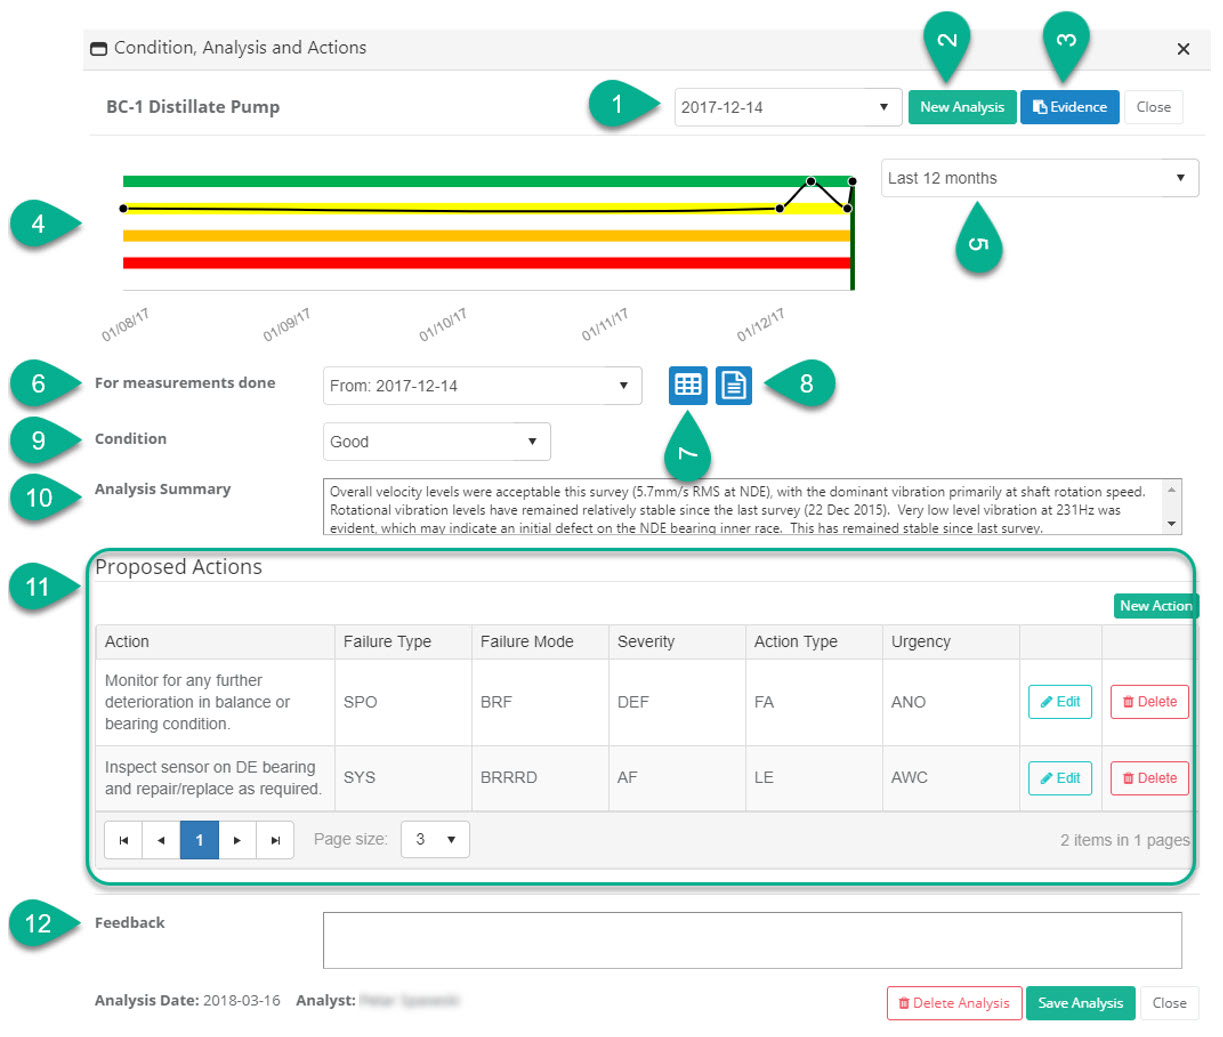
Condition Analysis
Condition Analysis or Analysis summary can be accessed from the header of the Analyse module by clicking on the “Analysis Summary” icon located on the top right corner.
This module can also be accessed from “Equipment Status” module and equipment page by clicking on the “Analysis Summary” icon in front of the equipment or on the right side respectively.
It is designed for analyst to write their analysis summary and propose actions to the client. Includes following features:
Drop down including past analysis, used to navigate through all equipment analysis;
Open a new analysis;
Analysis evidence – section to store all external document or images supporting user findings;
Equipment condition trend. Trend is clickable and used to in same manner as a top down box – to select (load) past analysis;
Timeframe dropdown linked to the condition trend;
“For measurements done” dates dropdown lists from-to dates when route was started and completed;
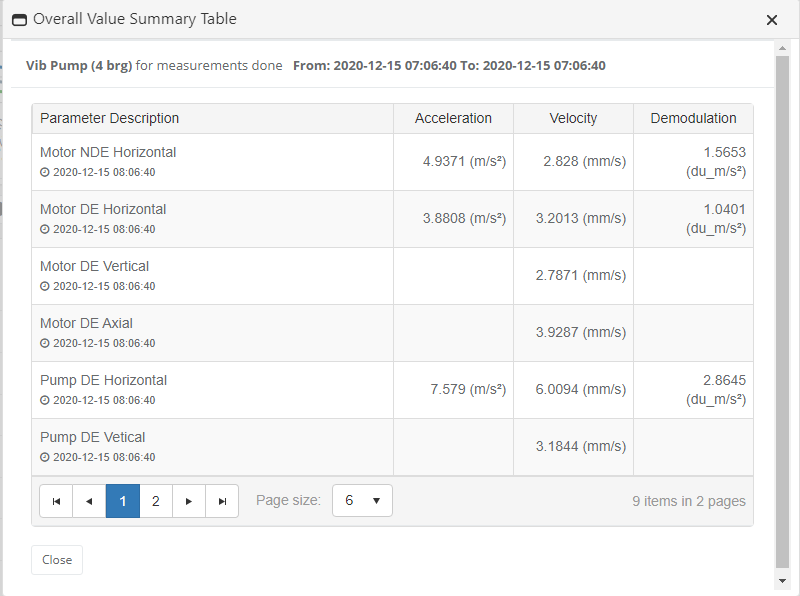
“Overall Values Summary Table” icon shows overall RMS values in a tabular format. If limits have been specified for the parameters they would be visible here in a traffic light system;
“Route Details” icon when clicked presents all information for the route analysed;
“Condition” dropdown outlines equipment condition for selected analysis instance;
“Analysis Summary” text box contains analyst findings and comments;
In “Proposed actions” area analyst suggests action/s to the client;
“Feedback” section is nominated for the client feedback related to the selected analysis or route;
Overall Value Summary Table
Overall Value Summary Table can be accessed from the menu icon located on the top right corner. Table contains measured values for all vibration parameters from equipment where current selected parameter belong and from the same route.
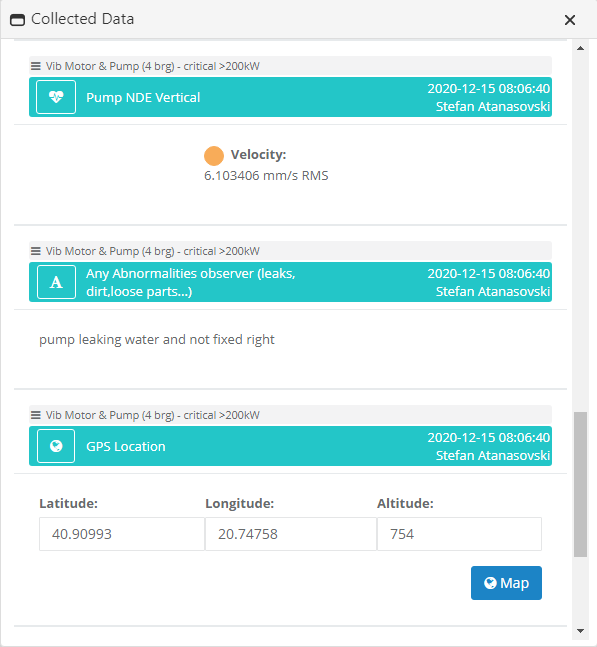
Collected Route Data
Collected Route Data can be accessed from the menu icon located on the top right corner. List contains measured values for all parameters from selected measurement (selected route).
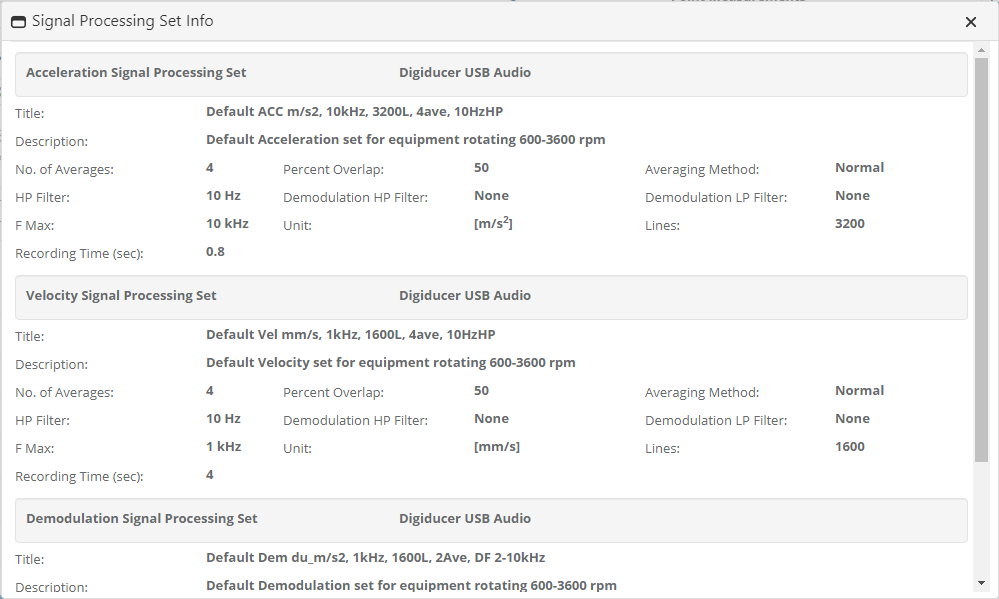
Signal Processing Set Info
Signal Processing Set Info can be accessed from the menu icon located on the top right corner. It contains information for settings in selected processing sets for each Acceleration, Velocity, Demodulation.
Notes
Notes can be accessed from the menu icon located on the top right corner. This form contains notes for the equipment and associated parameters.
There are two types of notes:
Equipment notes - notes related for the entire equipment
Parameter notes - notes related to specific parameter from the selected equipment
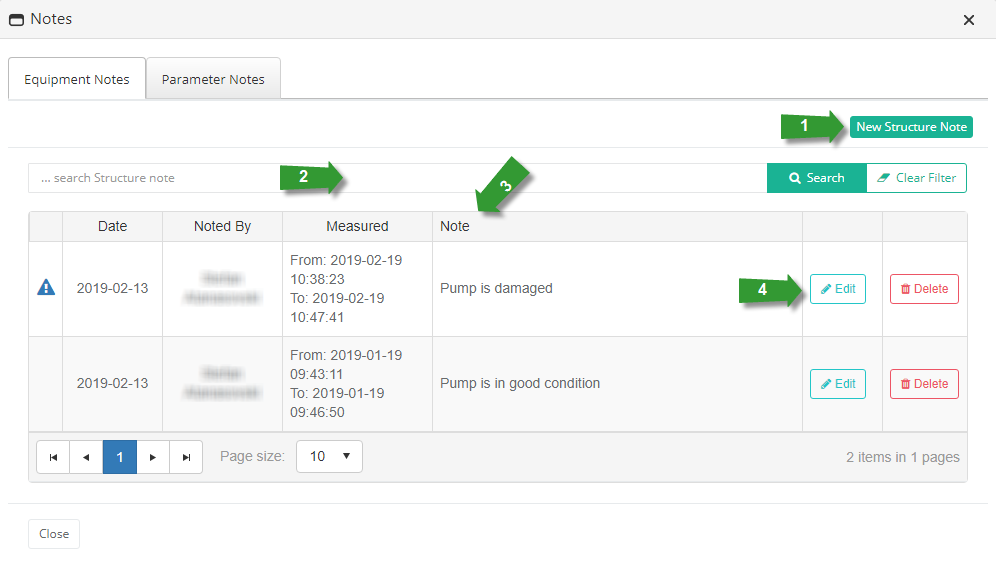
Equipment notes:
Click to create new Structure Note
Search through list of all nodes in the client structure
List of all structure notes already defined with information for when and who write the note, for which measurement date are notes related, note text as well as marker that indicates if current note is important or not.
Options for Edit and Delete each note
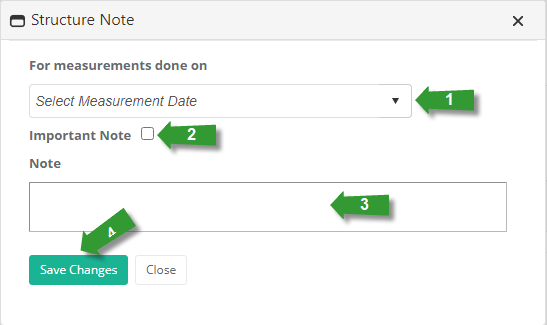
Creating new Structure Note:
Selecte Measurement Date
Mark if the note is important
Insert free text
Click to Save the changes
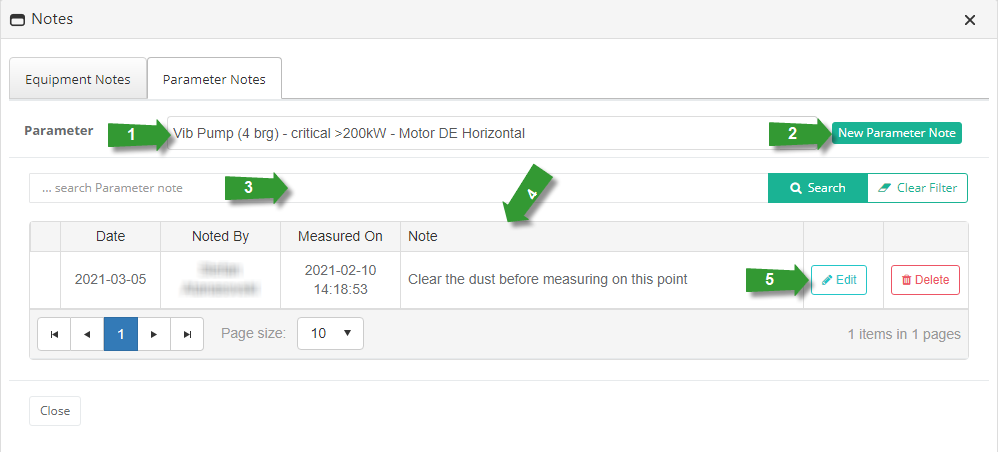
Parameter notes:
Select Parameter from the list (list of all Equipment parameter)
Click to create new Parameter Note
Search through list of all parameter in current equipment
List of all parameter notes already defined with information for when and who write the note, for which measurement date are notes related, note text as well as marker that indicates if current note is important or not.
Options for Edit and Delete each note
Creating new parameter note is the same as creating structure note explained above.